New plugin hook - client-enrichment-plugin

· One min read

A new client-enrichment-plugin hook is available.

This plugin allows to resolve client identification extracted from JWT or Basic auth against an external system.

The enrichment is applied to:

  • Grid, and export
  • Filters
  • Details
  • Stats
  • And map!

Example

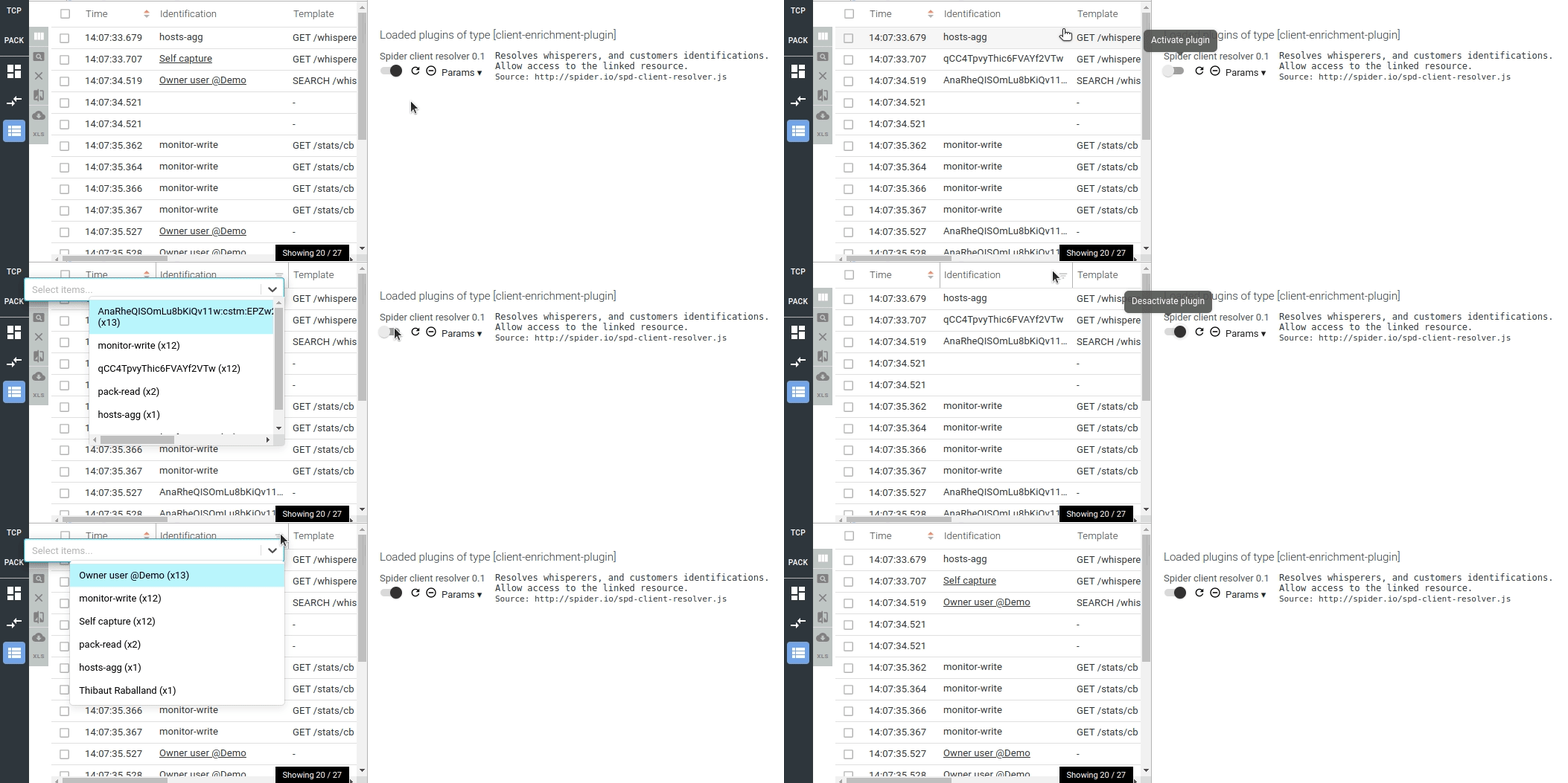
This sample plugin decodes Spiders own identifiers of JWT tokens to display name of Whisperers and Users.

It is available here: https://gitlab.com/spider-plugins/spd-client-resolver

In grid & filters:

In map:

Plugin API

{
inputs: {identification, mode},
parameters: {},
callbacks: {setDecodedClient, onShowInfo, onShowError, onShowWarning, onOpenResource},
libs: {React}
}
  • identification: value of the identification to resolve (JWT sub field, or Basic auth login)
  • mode: 'REACT' or 'TEXT', depending on the expected output
  • onOpenResource({id, title, contentType, payload}): callback to open a downloaded payload in details panel. XML and JSON are supported.
    • id: id of the resource, to manage breadcrumb
    • title: displayed at the top of details panel
    • contentType: application/json or application/xml are supported
    • payload: the resource content (string)

Logo change

· One min read

After several advices from people that found Spider logo a too 'evil' because of the strong eyes, I studied how to change it for the best.

I changed eays position and look so that the Spider now seems too look below it, watchfull for what happens on its web.

Tell me what you think!

Anonymous statistics as a user choice

· One min read

User may now chose on its own to anonymize its usage statistics. It is available in the Settings panel.

The statistics are anonymized so that no link can be made between the statistics and the user. UserId and email are replaced by a client side generated UUID that is regenerated at each user login, or when the anonymous stats flag is changed.

Spider is getting more and more ready.

Another scaling limiting feature removed :)

· One min read

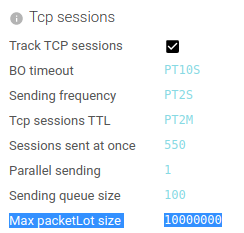
When too many TCP sessions or HTTP communications are parsed in the same minute, their count could overflow Node.js or Redis capabilities to manage in a single call.

I couldn't see it before since I had to scale parsing services with many more instances that now. Now parsing services are more efficient. They can handle much more load by each single replica, but then, they reach a limit in scaling!

After much study and not finding a way to simplify the data sent, I decided to... chunk the calls in pieces ;) Simple solution =)

So now, big loads do not generate errors and are absorb quite smoothly.

Last statistics are showing that Spider processes 400 MB/min with only 8 CPU cores fully used :) Nice!

Consent validation

· One min read

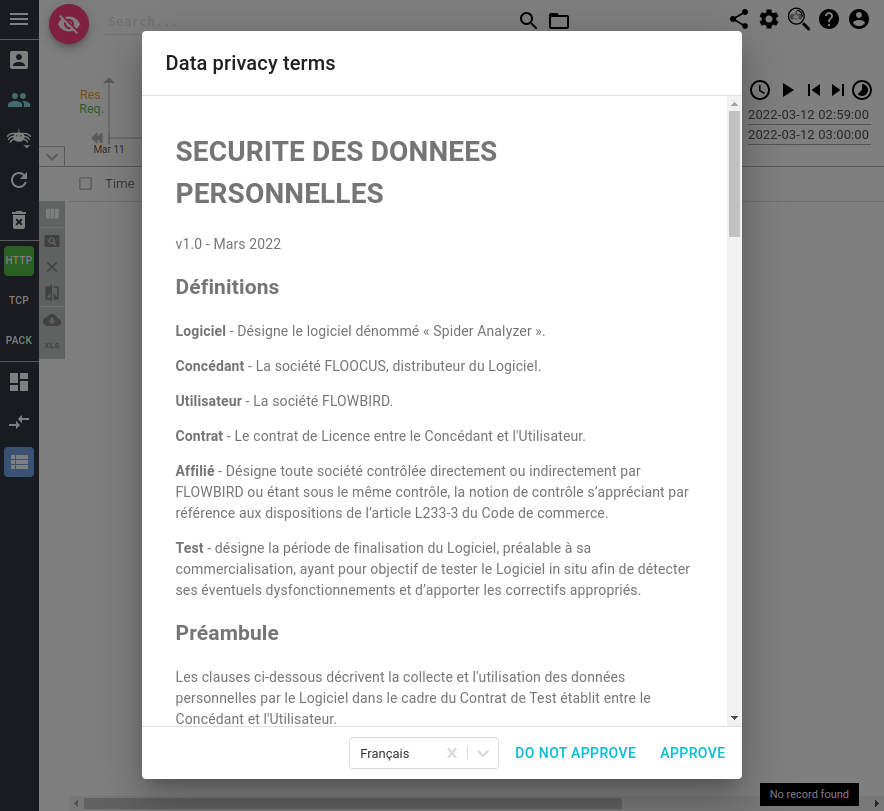
I've just added Consent validation of Privacy terms.

This complies with GDPR regulations to inform the user of collected private data, and the processing behind.

  • Consent is mandatory to use Spider
  • User consent is saved on the server and requested again when the terms changes

Date of consent and terms may be accessed later on the new Help page. (See next post)

Grid link UX improvement

· One min read

When building training support I found that automatic filter when clicking the link icon in the grid was not using smartfilters.

I changed that quickly :) So that from a /controlRights item in the grid to the fan out display in the sequence diagram, you're only 1 click away !

New Help details

· One min read

Instead of only redirecting to https://spider-analyzer.io, now the Help page provides more information.

  • The classic About terms.
  • The Changelog - that moved position from an independent details to here.
  • The list of Free and Open Source tools and libraries used with their licences.
    • It takes a bit of time to... render ;)

The content is driven by a jsonld public manifest file visible in the Manifest tab.

New alert probe

· One min read

I just added an alert probe that alerts the administrator when the parsing delay gets over a threshold (default to 30s).

This complements the work done on parsing delay monitoring.


I'm studying now the possibility to add alert status to the monitoring UI, and the parsing delay in monitor-write tooltip. ... for later !

Improved free time selection

· One min read

Playing with Spider during non regression with very old pcap captures files, I kept fighting with the free time selection inputs on the right of the timeline.

It was difficult to move to 2018 or such!

I figured out that validation and change acceptance of those inputs needed to be done on both inputs together. So I redesigned the UX there, and it is much better now IMO :)

Tell me what you think!

  • You may validate a change of only one input by pressing enter (when no error)

  • You may validate a change of both input at once with the validation button

    • Thus this allows moving far and fast in time by changing both inputs, and validate only when finished.
  • When there is an error, the error text shows up with the possibility to cancel the change.

How does Spider cope with an 2x load for 15 min?

· 3 min read

Today, checking monitoring at the end of day, I found a spike of 'parsing errors' in the morning. The monitoring helped me find out why. take the path with me:

1 - Looking at the logs dashboard 

We can see a spike in logs - nearly 6000!! - around 10:13. The aggregation by codes show us very easily that there have been parsing issues, and when opening the log detail, because there were missing packets.

Let's find the root cause.

2- Looking at the parsing dashboard

We can see an increase of Tcp session in waiting to be parsed in the queue, and the parsing duration and delay increasing.

Many HTTP coms were still created, so there is no like, errors, but only in increase of demand.

There is a small red part of the Parsing status histogram, with 5603 sessions in errors out of 56000.

3- Further on, in the services dashboard

There is definitely an increase of input load, and an even more increase of created Http Coms. The input load almost doubled in size!

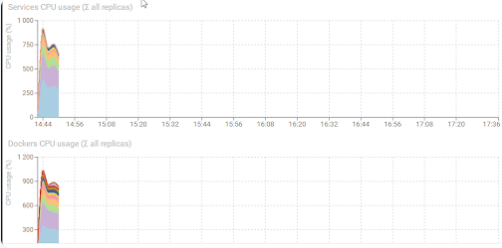
CPU is still good, with a net increase of parsing service.

4- Looking at DB status

Redis doubled its load, with a high increase in RAM, but it came back to normal straight after :) Works like a charm!

Response time and content of Redis increase significantly but nothing worrying. The spike has been absorbed.

Elasticsearch shows a net increase of new communications indexation.

5- Then the whisperers dashboard gives us the answer

In fact, all was normal, it's only the performance team (SPT1 whisperer) that decided to capture one of their test :-)


That's good observability capabilities, don't you think? All in all, everything when well.

  • The spike was absorbed for almost 15 minutes,
  • But the parsing replicas where not enough to cope with the input load, and the delay of parsing increased regularly
  • So much that Redis started removing data before it got parsed (when the parsing delay reached 45s, the TTL of packets)
    • Watch again the second set of diagrams to check this.
  • Then the parsers started complaining about missing packets when parsing the Tcp sessions. The system was in 'security' mode, avoiding to crash and avoiding the load increase.
  • All went back to normal after SPT1 stopped testing.

The system works well :) Yeah! Thank you for the improvised test, performance team !

We may also deduced from this event that parsing service replicas may be increased safely to absorb the spike. As the CPU usage still offered room for it. Auto scaling would be the best in this case.

Cheers, Thibaut