What's Spider
Spider shows you what your services really say to each other, without touching their code.
It captures network traffic in your Kubernetes clusters, decrypts it, decodes it into readable communications (HTTP, gRPC, PostgreSQL, Kafka and more) and gives you a live map, a searchable history and the tools to find the root cause of an error in minutes.
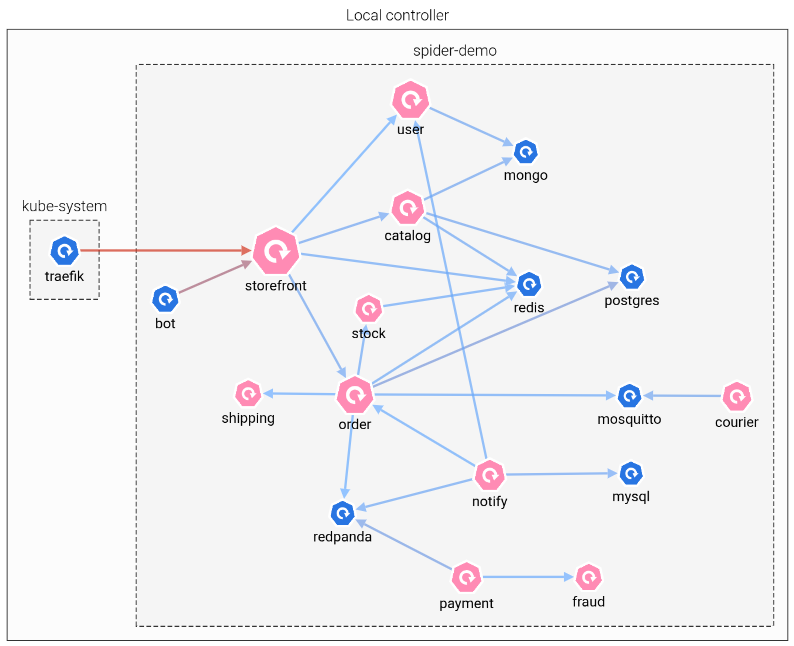
From a symptom to the root cause
- Attach. Pick a workload in the web application. Spider injects a capture agent into it, with no restart and no change to your code.
- Watch. Every call between your services appears, already decoded: the HTTP route, the SQL query, the Kafka topic, the gRPC method, with their real status and duration.
- Find. Filter on the failing call, open its request and response, follow it across services, and see which hop broke.
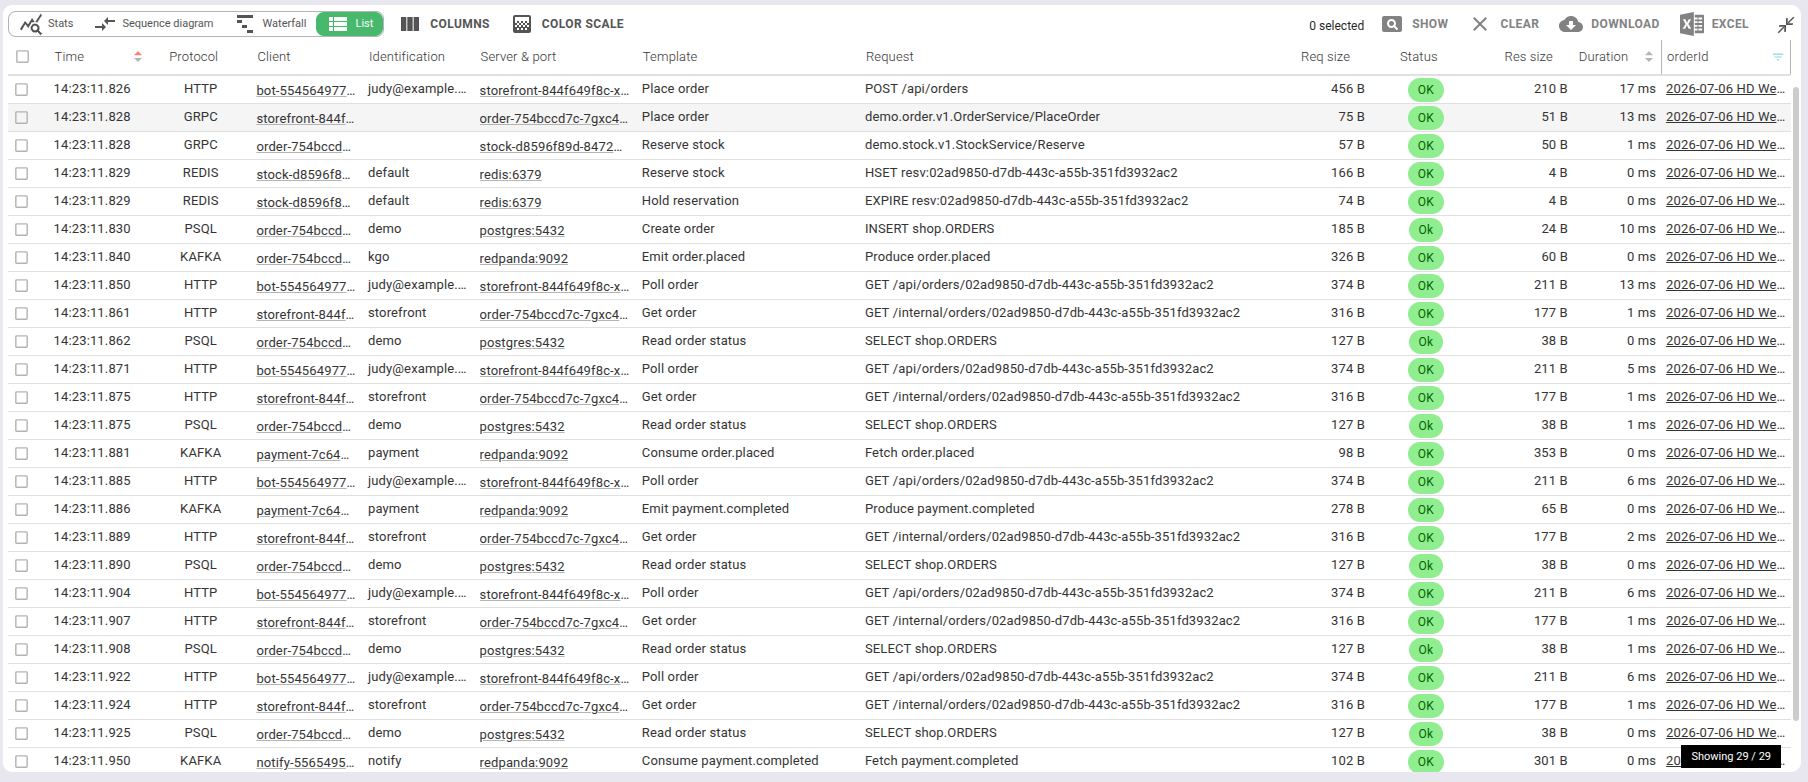
What Spider understands
HTTP/1.x, HTTP/2 and HTTP/3, gRPC, GraphQL, PostgreSQL, MySQL, Redis, Kafka, WebSocket and SSE, MCP, DNS, MQTT, MongoDB, and your own protocols through plugins. TLS traffic is deciphered, and each communication is tied to the Kubernetes workload on both ends.
See the key features for the full list.
Why not something else?
| If you use... | What it gives you | What Spider adds |
|---|---|---|
| Wireshark, tcpdump | Raw packets on one machine, analysed by hand | Capture across a whole cluster, always on, decoded at application level, searchable, shared by your team |
| Datadog, Dynatrace, New Relic (APM) | Deep view of the services you instrument, with their agents or SDKs | The wire truth, including third-party products, databases and legacy services that nobody instrumented |
| OpenTelemetry, Jaeger, Tempo (tracing) | Traces, as long as every service is instrumented and propagates the context | Communications without instrumentation, plus correlation of one request across services from the headers already on the wire |
| Cilium Hubble, Pixie (eBPF observability) | Cluster network and application visibility from the kernel | Retention beyond the live window, TLS decryption, full payloads with redaction, and a unified multi-protocol analysis view |
| Service meshes (Istio, Linkerd) | Telemetry for the traffic that goes through the mesh sidecars | Visibility without deploying a mesh, or on the traffic the mesh does not cover |
These tools are complementary, and Spider runs happily next to them. It does not replace metrics or application logs: it answers the question they cannot, "what was actually said between these two components?".
Who is it for?
Teams that build or run a system made of several components, and lose days to issues they cannot see:
- Developers and integrators who need to understand how their services, or a third-party product, really behave.
- Support and operations teams who need evidence of what happened, without asking a developer to add logs.
- Platform teams running Kubernetes microservices, where every incident crosses several services.
Try it
- See it first: open the live demo, a guided walkthrough on a multi-protocol demo shop.
- Start with your own data: follow the quickstart.
- Understand how it works: read How does it do it? and the system architecture.
Spider can be used as a SaaS, or installed on your premises.
"Spider"?
It works like the spider that hunts bugs in its web by listening to the small vibrations.
A new generation sniffer.