Live demo
Watch Spider decrypt live traffic across 9 protocols
A synthetic online store runs 24/7.
A bot places real orders that cross HTTPS (1.1, 2 & 3), gRPC, Redis, PostgreSQL, MySQL, Kafka, and WebSocket.
All communications are encrypted with TLS
Spider captures, decrypts it server-side with no instrumentation, and traces every order end-to-end.
What you are looking at
- 6 polyglot services (Go + Node) behind a storefront.
- One order traverses HTTPS → gRPC → Redis → PostgreSQL → Kafka → MySQL.
- Every hop is TLS-encrypted; Spider decrypts it via eBPF.
- Two identifiers ride along: one Spider extracts with zero configuration, one you configure - and the gap between them is the point.
- A 24/7 bot keeps the system busy so there is always live traffic.
Watch the live system
Open a live view of the whole store - the map and the decrypted communications, streaming as the bot works.
You will enter your email and a one-time code to view.
Watch your own order
Open the store, place an order in two clicks, then follow your own order traced across all nine protocols.
You will enter your email and a one-time code to view.
A guided tour - what you are seeing, and what to look for
You clicked in above. Follow along here: this walkthrough maps the demo system, shows how Spider captures and decrypts it, then follows one order across all nine protocols - from raw packets to the business record - with real Spider screenshots and where to find each in the UI.
The storefront - this is what you are watching
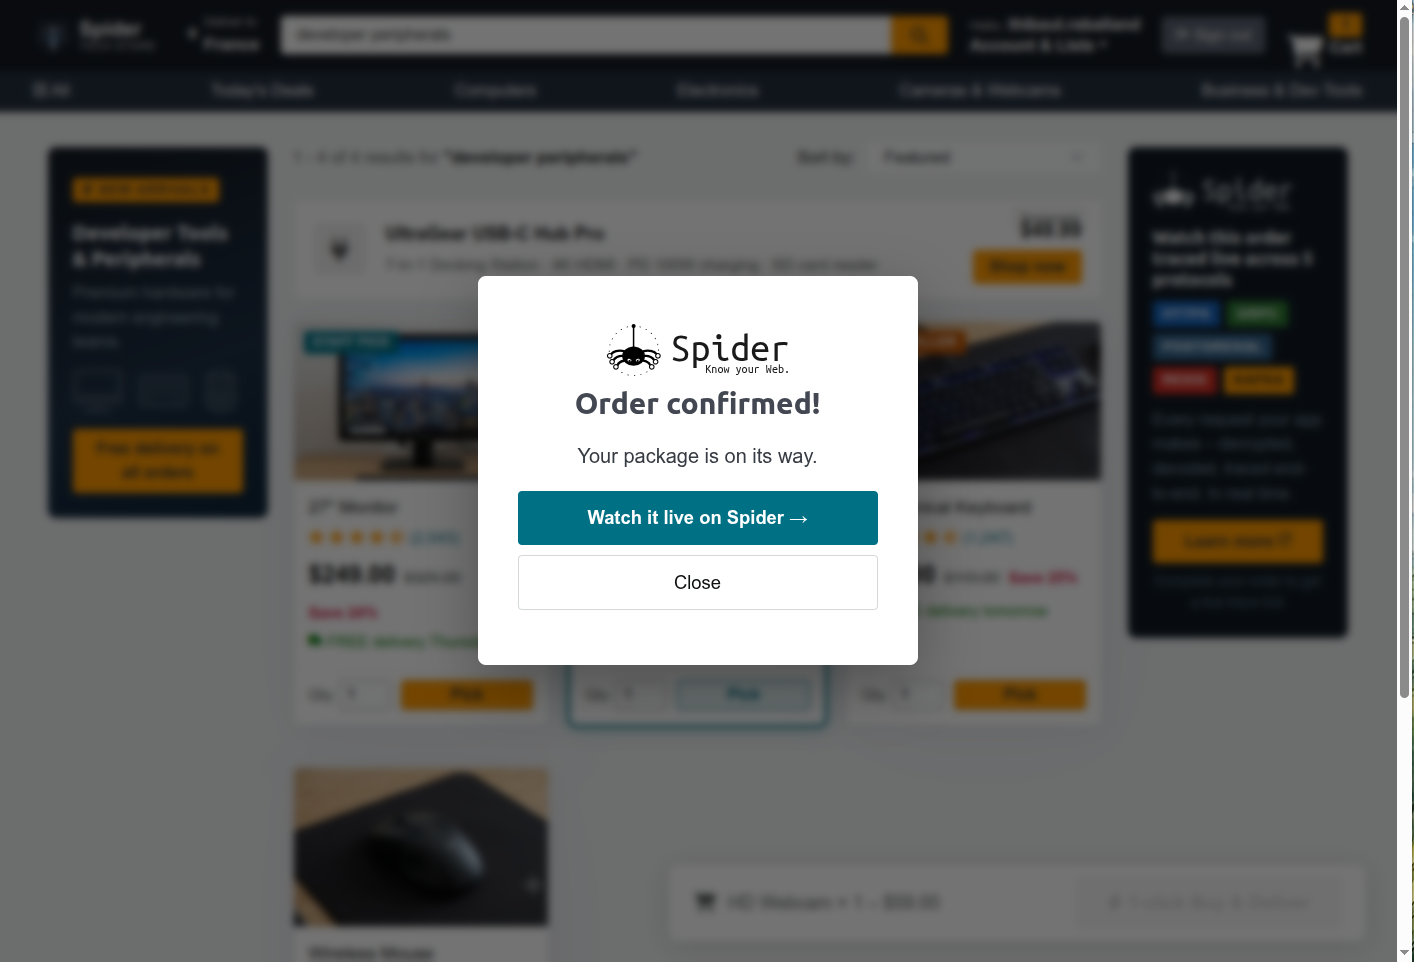
A synthetic e-commerce store runs 24/7 in the demo environment. Real orders flow through it continuously, exercising the whole backend stack.
Every order you see placed here is about to travel through six services and nine protocols - HTTP/1.1, HTTP/2 and HTTP/3 side by side, gRPC, Redis, PostgreSQL, MySQL, Kafka and WebSocket - plus GraphQL over HTTP and WebSocket, encrypted end to end.
What runs behind the store
Six polyglot services sit behind the shop - three in Go (order, stock, catalog) and three in Node.js (storefront, payment, notify) - plus Redis, PostgreSQL, MySQL and a Redpanda (Kafka) broker.
storefront is the HTTPS entry point; order orchestrates the purchase over gRPC; stock holds the reservation in Redis; order persists to PostgreSQL and publishes an order.placed event to Redpanda, which payment and notify consume asynchronously. notify also records a customer and an invoice for each paid order in MySQL. Normally, following one order across all of this means stitching together logs from every service.
The HTTP hops are deliberately mixed. storefront talks to catalog and to order over HTTP/2, order calls catalog once per order over HTTP/3 (QUIC), while notify acknowledges the order back over HTTP/1.1 - on the same port order serves HTTP/2 on. Spider decides the framing per connection from the decrypted bytes, because a port cannot tell you: TLS 1.3 hides the ALPN negotiation inside EncryptedExtensions. Both show up in the grid with their own httpVersion, the same tags and the same templates, and catalog's product list even answers with an HTTP/2 trailer - a header that only exists once the body is finished.
How Spider captures encrypted traffic - without touching your code
The whisperer is injected into a running pod as an ephemeral debug container - a tiny sidecar that Kubernetes attaches on demand. It shares the pod's network namespace and sniffs that pod's traffic. No image rebuild, no permanent sidecar, no code change.
Gocipher runs as a DaemonSet - one instance per node - and hooks OpenSSL through eBPF uprobes to extract TLS master secrets. Spider uses those keys to decrypt the captured packets after the fact.
Where Spider is watching from
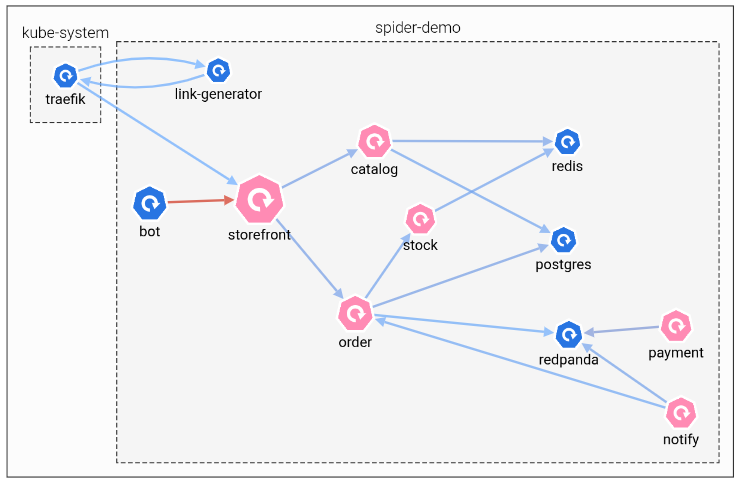
This is Spider's own map of the running demo - every component it has discovered, grouped by Kubernetes namespace. The whole shop is here: storefront, catalog, order, stock, payment and notify, plus Redis, PostgreSQL and the Redpanda broker, the Traefik ingress, and the bot generating traffic.
The services drawn in pink are the ones a whisperer is attached to. Spider taps the application pods - not the datastores, not the broker - and still sees both sides of every conversation, which is all it needs to reconstruct the full cross-service story.
Proof: from TLS ciphertext to plaintext
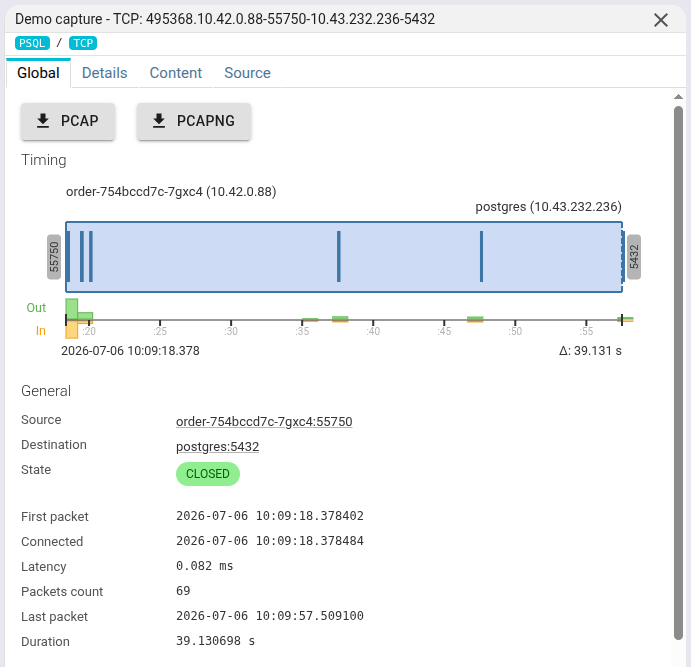
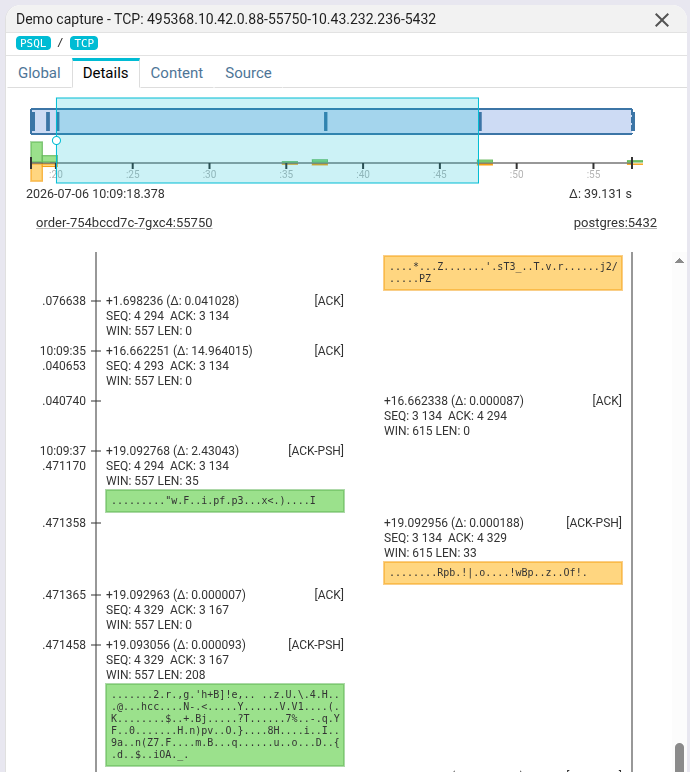
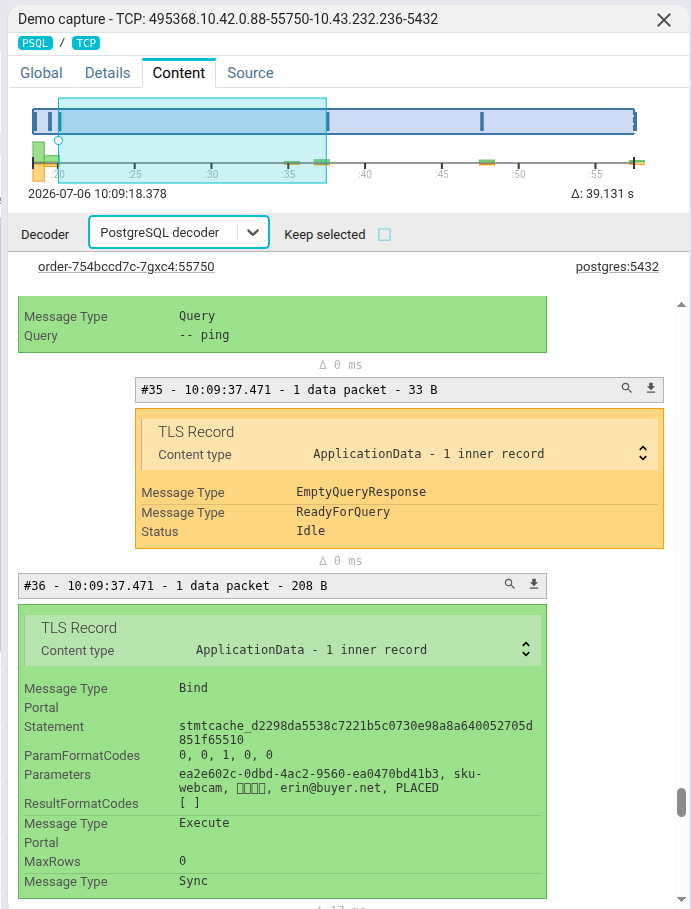
Every capture is a TCP session, and Spider keeps the whole thing. Here is one between the order service and postgres:5432 - 69 packets over 39 seconds, the full pipe, downloadable as raw PCAP.
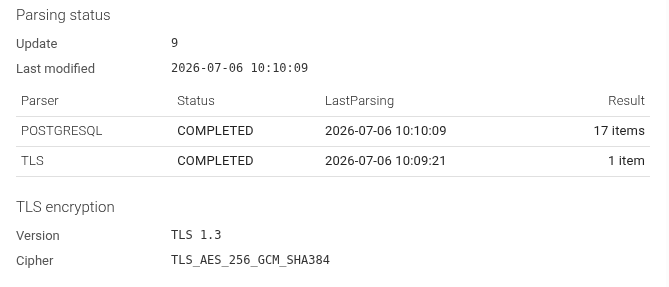
Spider identifies the handshake - TLS 1.3, cipher TLS_AES_256_GCM_SHA384 - and reports what it parsed (TLS and PostgreSQL, both COMPLETED). Open the Details tab and you see exactly what crossed the wire: encrypted TLS records, pure ciphertext.
Now switch to Content with the PostgreSQL decoder. Spider peels back each TLS record and decodes the Postgres protocol underneath - the Bind and Execute messages, the prepared statement, and the real parameters: the order UUID, sku-webcam, the buyer's email, the PLACED status. That is the headline claim, proven end to end - encrypted on the wire, readable in Spider, with nothing instrumented.
The journey of a single order - by design
A single order exercises all nine protocols. storefront takes the HTTPS request and calls order over gRPC (PlaceOrder). order calls stock over gRPC (Reserve), which holds the reservation in Redis. order writes the row to PostgreSQL and produces an order.placed event to Redpanda (Kafka).
payment consumes that event asynchronously and produces payment.completed; notify consumes that in turn and acks back to order over HTTP, which updates PostgreSQL and publishes the order's ACKNOWLEDGED status to Redis. Meanwhile the bot or browser has already upgraded its own connection to a WebSocket and subscribed to that order - storefront reads its current status for an immediate initial sync, then relays each further transition order publishes over Redis pub/sub as a status frame on the same connection. Every hop is TLS-encrypted; Spider captures all of it from the network and reassembles the whole path.
…and the same journey, actually captured
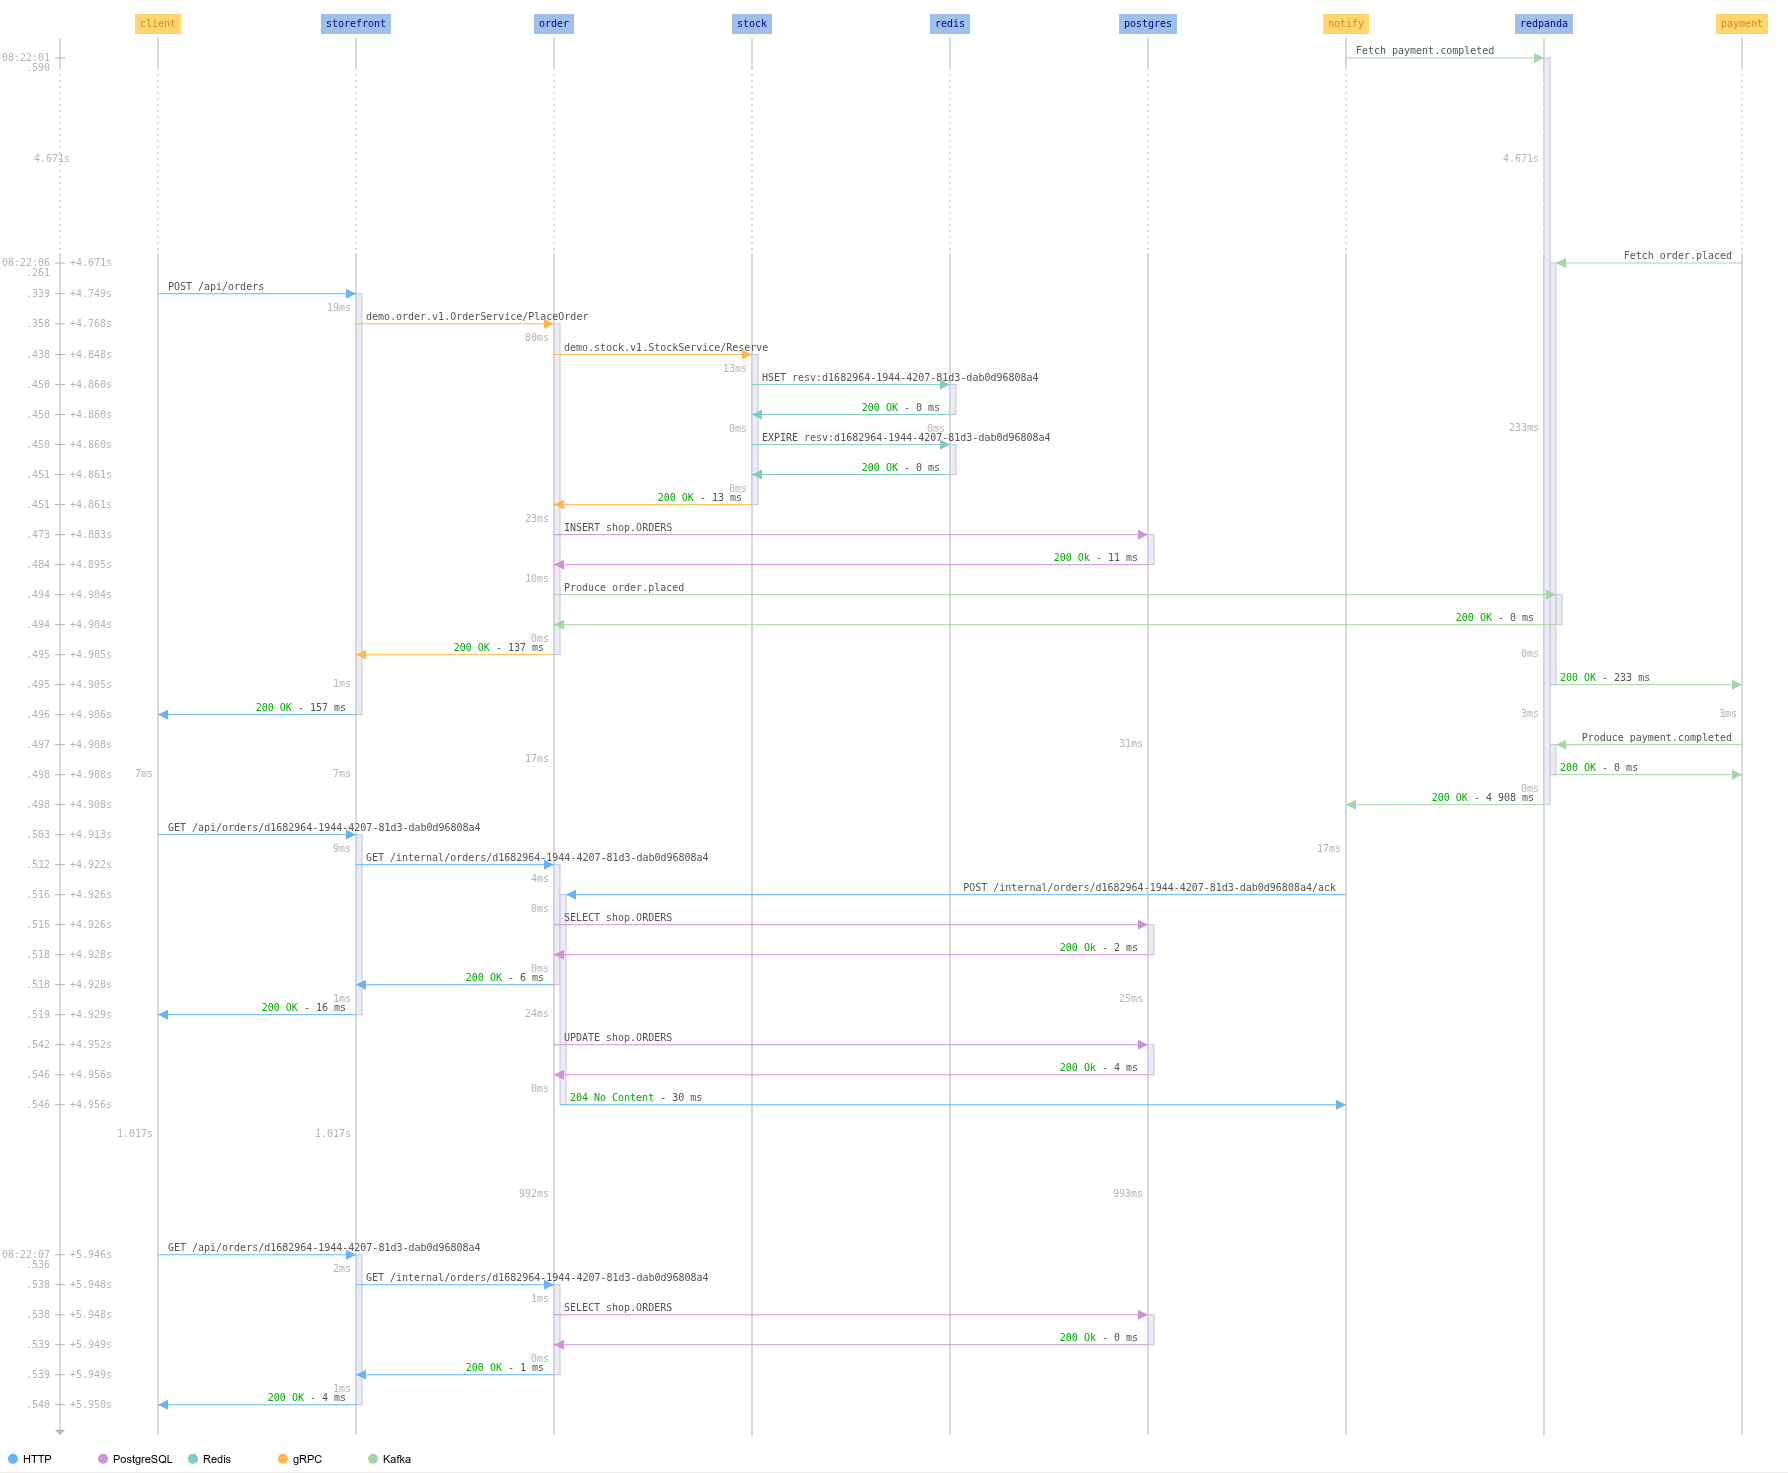
The diagram above is the design. This one is real: Spider drew it from the decrypted packets of one specific order - the same eight participants, every gRPC, Redis, PostgreSQL, Kafka, HTTP and WebSocket hop, with real timestamps and durations down to the millisecond.
Nothing was instrumented to produce it. Spider reconstructed the entire cross-protocol sequence - including the asynchronous payment.completed round-trip - purely from captured traffic.
Every call for one order, in a single list
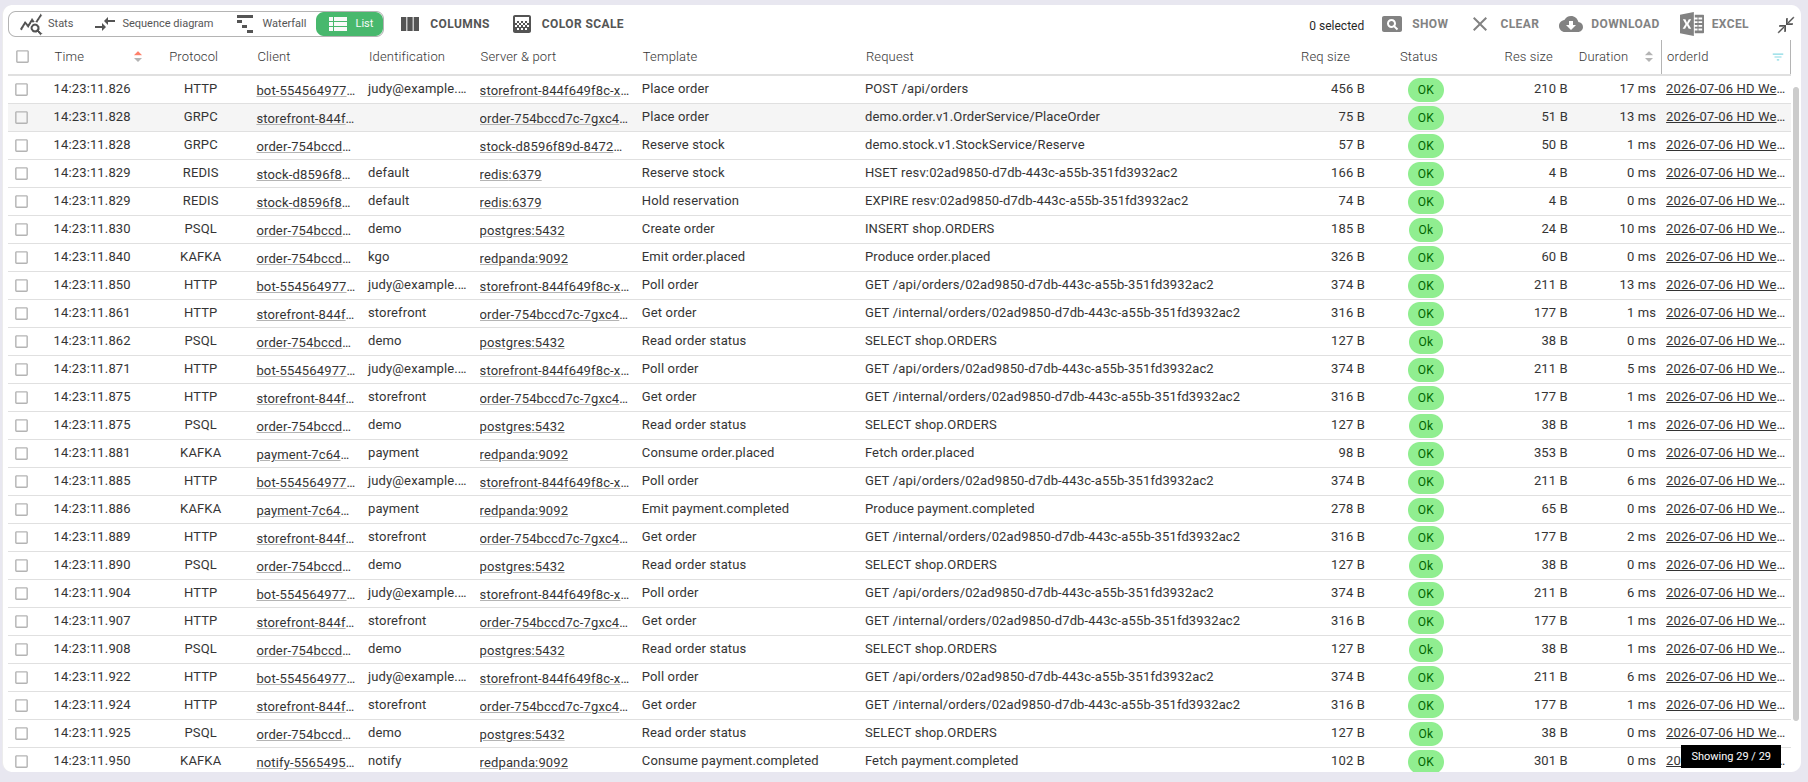
Spider's grid lists every captured call that belongs to one order, side by side, whatever the protocol: the HTTP POST /api/orders, the gRPC PlaceOrder and Reserve, the Redis HSET/EXPIRE and PUBLISH/MESSAGE, the PostgreSQL INSERT/SELECT/UPDATE, the Kafka order.placed and payment.completed, and the WebSocket status frames.
Each row carries a readable template name (Place order, Reserve stock, Create order…), the real request, sizes, status and duration - and the extracted orderId on the right, the same value on every row. That shared ID is what ties the list together.
Open a gRPC call and read the decrypted payload
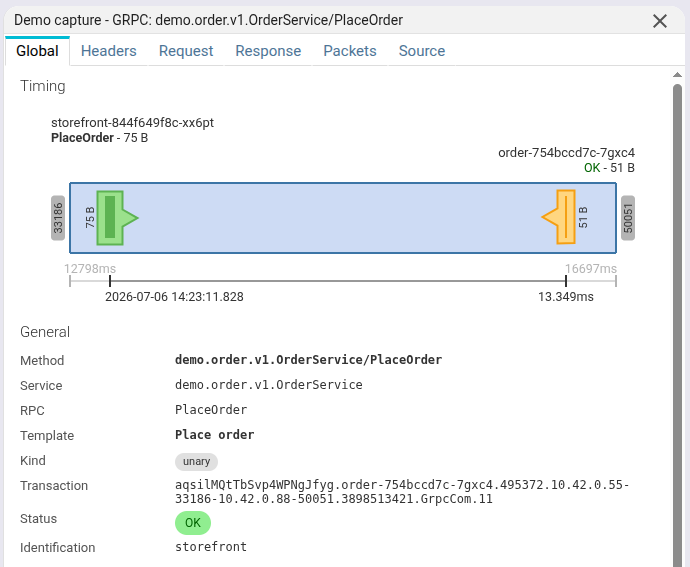
gRPC is binary and TLS-encrypted - normally a black box. Click any call and Spider shows the whole thing: the method (demo.order.v1.OrderService/PlaceOrder), the timing, request and response sizes, status, and the client and server pods.
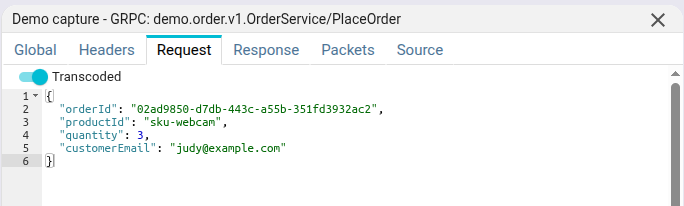
Flip on Transcoded in the Request tab and the raw protobuf becomes readable JSON - the orderId, the productId, the quantity, the customer's email. Spider decrypted the packets, reassembled the gRPC frames and decoded the protobuf for you.
MySQL: a transaction, prepared statements and a real error
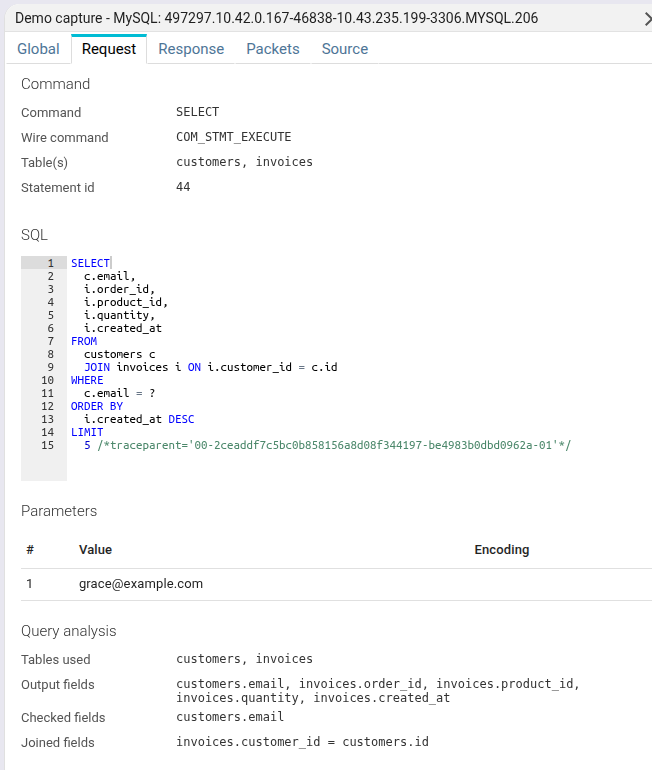
notify keeps a ledger in MySQL 8.4, over TLS. For each paid order it opens a transaction, upserts the customer, inserts the invoice and commits, then reads the customer's last five invoices with a JOIN. Every data statement is prepared, so the wire carries PREPARE, EXECUTE and CLOSE - and Spider pairs each EXECUTE with the statement text it was prepared from, bound parameters included.
Open the history read and Spider has already analysed it: the tables it touched and the fields it filtered on.
Now and then notify replays an invoice it already wrote - the way a redelivered message would - and MySQL refuses it with a genuine error 1062, SQLSTATE 23000, before the transaction rolls back. Nothing simulated it on the Spider side; it is decoded straight from the server's reply.
How Spider pulls the order ID out of the traffic
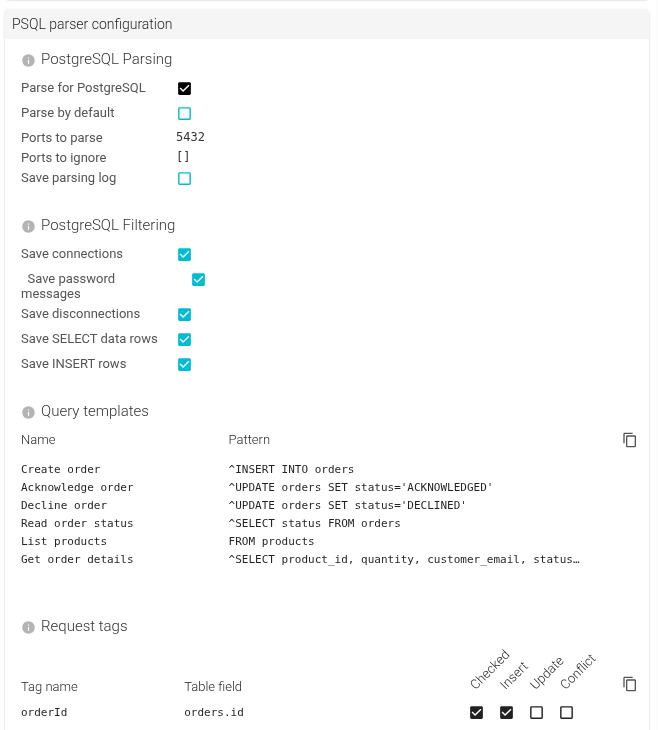
This is where the linking comes from. Each whisperer carries a parsing configuration. For PostgreSQL, Spider is given the query templates that matter - Create order is ^INSERT INTO orders, Read order status is ^SELECT status FROM orders - so raw SQL gets a human name.
More importantly, a request tag maps orderId to the orders.id column. Spider parses the query, understands which field is which, and extracts the value - and does the same across the other protocols, so the one order ID is recovered wherever it travels: HTTP body, gRPC message, Redis key, SQL row, Kafka event.
MySQL gets the same treatment: orderId is mapped to invoices.order_id, and the invoice insert's bound parameter supplies the value.
HTTP/3 is enabled per whisperer too: UDP session tracking plus parseHttp3 on port 8443, where order calls catalog once per order. Spider decrypts it from the QUIC keys Gocipher captures, and tags it with orderId from the X-Order-Id header.
Two identifiers, and the difference is the whole point
Every order in this demo carries two identifiers, and they are not redundant - they answer different questions and cost you different amounts of work.
correlationId is technical correlation. It comes from a W3C traceparent injected by real OpenTelemetry instrumentation in the demo's services. Spider extracts it with nothing configured - the rules ship pre-written, and a fresh install links this chain on its first capture. It reaches HTTP, gRPC, Kafka, PostgreSQL and MySQL, and it survives the whole asynchronous tail: the order.placed event, payment's reply, notify's ack and the final UPDATE all carry the same one. Trace propagation genuinely works here.
One qualification, on the database hops. Spider needs nothing, but the application does: SQL has no header, so the traceparent has to travel as a comment in the query text, and stock instrumentation does not always put it there. OpenTelemetry's MySQL instrumentation for Node skips prepared statements by design, and in this shop every MySQL data statement is prepared. The Go PostgreSQL driver has no hook that can rewrite the query at all. So notify and order carry a few lines of code of our own to add the comment, and even then a statement close carries none. orderId needed no code change anywhere: Spider reads it from values the services already send.
Where it is absent is the interesting part, and it is not only Redis. RESP has nowhere to carry a propagation header, so the reservation's Redis commands have none - that much was expected. But neither does anything the customer's own client did: the order it posted, the WebSocket it opened, the subscribe frame it sent. The client is not instrumented, which is exactly the situation you are in with any browser, mobile app or third-party caller you do not control.
The live feed is the case in between, and it is worth understanding. The trace id does reach the Redis publish, its delivery to storefront and the WebSocket frame the customer finally sees - but not because anything propagated it. order writes the active trace id into the event payload, and a tag rule reads it back out of the Redis arguments and the WebSocket frame. That is configuration, not instrumentation: the same ten minutes orderId costs, on a hop no header could have reached.
orderId is business correlation. It is the order UUID, pulled out of wherever it already lives on each hop - a protobuf field, a Redis key, a SQL column, a Kafka record, the WebSocket URI - by the tag rules you saw in the previous step. It costs you ten minutes of configuration. In exchange it reaches all nine protocols, including the Redis hop and the WebSocket connection nobody instrumented, and it names the thing your business actually cares about.
Read the diagram above with both identifiers in mind. The first correlationId covers the instrumented hops out of the box, the MySQL statements included since they carry the traceparent comment, plus the publishes, their deliveries and the frame that reaches the customer - those only because of the payload rule above. The reservation commands, the customer's own hops, the close frames, storefront's initial-sync frame, which it composes itself from a read rather than from any published event, and the statement closes carry no correlationId at all, and the status read behind the live feed belongs to a second trace entirely. orderId covers every call that carries the order. (The simulated out-of-stock and payment-declined paths short-circuit, and the ~5% duplicate-invoice redelivery adds a rolled-back transaction.)
The MySQL block is the one place the two identifiers trade places. notify's transaction opens with a BEGIN, upserts the customer, inserts the invoice and commits - and only the invoice insert contains the order id. The others carry nothing a business rule could extract. They all carry the traceparent comment, so correlationId ties the whole transaction to the order's trace while orderId finds exactly one statement of it.
So correlationId is what you get in the first twenty minutes, and orderId is what you get once you have told Spider what your business calls things. The technical one proves the request happened; the business one answers "what happened to this order", which is usually the question that was asked in the first place. Neither makes the argument alone.
That last group is the one to look at, because it does not close with better instrumentation. The two identifiers slice the traffic along different axes: a correlationId groups what followed from one request, while orderId groups everything that ever touched one order, across requests that have nothing technically to do with each other.
The live feed on the diagram is that argument in miniature. The customer opens a socket to watch the order - a new connection, so a new trace id, correctly so - and storefront reads the current status under that second trace to sync it. It is unmistakably about the same order. Perfect instrumentation would not merge the two; it would just give the watch a cleaner second trace. The same holds for anything that runs later: a webhook, a nightly reconciliation, a retention sweep. Each arrives with its own trace or none, and the order id is what ties them back together. Batching inverts it - fold a hundred orders into one sync call and that call has exactly one trace id covering all hundred, and only the business identifier still picks out yours.
In the grid, a communication carrying either one gets a link button in the Links column: click for the whole chain in the unified view, shift-click for its sequence diagram. Which tags earn that button is a setting, so you can point it at your own business identifier - and because it is a display setting rather than a capture setting, traffic captured months ago lights up immediately.
A plugin turns the UUID into business meaning
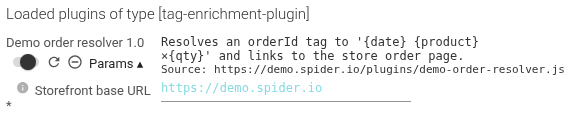

The extracted order ID is a UUID - correct, but not friendly. A small tag-enrichment plugin, the Demo order resolver, loaded in Spider's settings, turns eachorderId tag into something a human reads: here, "2026-07-06 HD Webcam ×3", built from the order's date and product.
The plugin also carries a link back to the store - so the tag is not just a label, it is a doorway to the business system.
One click from a packet to the business record
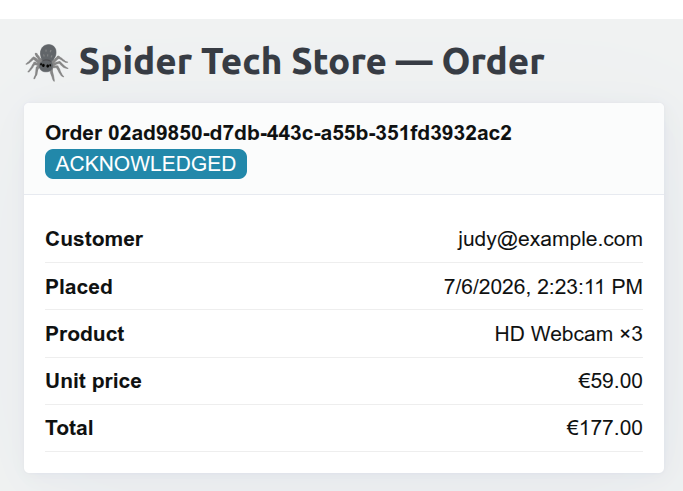
Click the enriched tag and Spider sends you straight to that order in the store's own back office - the Spider Tech Store order page, showing the same order: ACKNOWLEDGED, the customer, the product, the total.
That is the whole promise in one gesture. You started from raw, encrypted packets on the wire and landed on the business record they represent - no instrumentation anywhere, just capture, decode, and the identifiers already living in your data.
That was one order through one lens. Spider also gives you dashboards, statistics and pivot tables, waterfall timing, time-travel from days to microseconds, communication diffing and shareable analysis links - across every protocol it captures.
See all features →