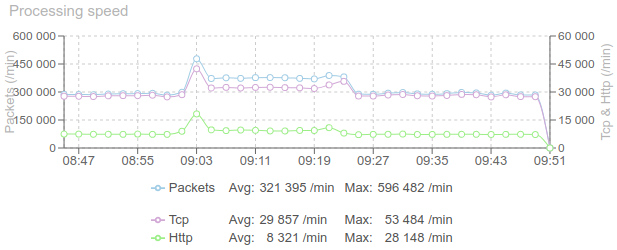
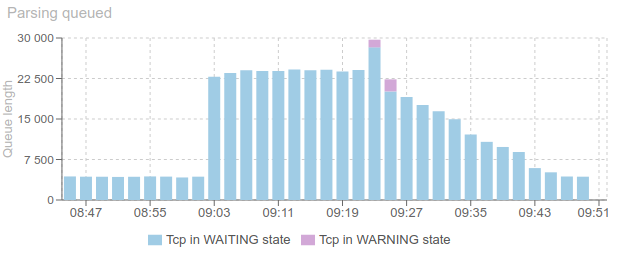
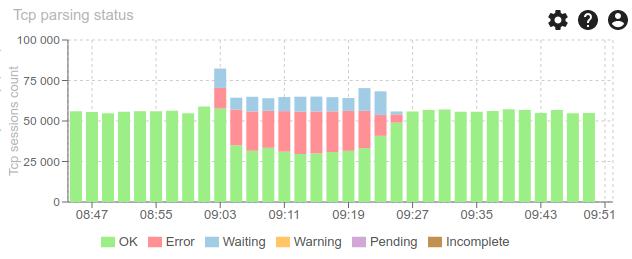
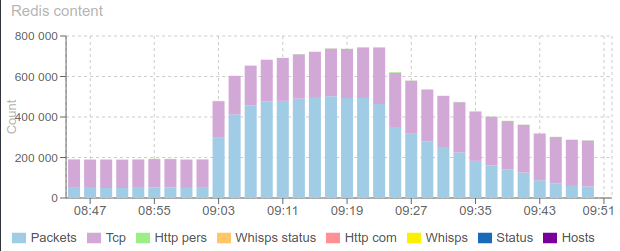
Due to upgrade to Redis 5.0.7, a bug that I'd been tracking for months has been solved (on Redis ;) ), and now parsing quality is 100% :-) apart from clients issues.

Then I moved to next phase: it is possible not to save parsing resources any more, thus leading to a huge optimisation in Elasticsearch usage...
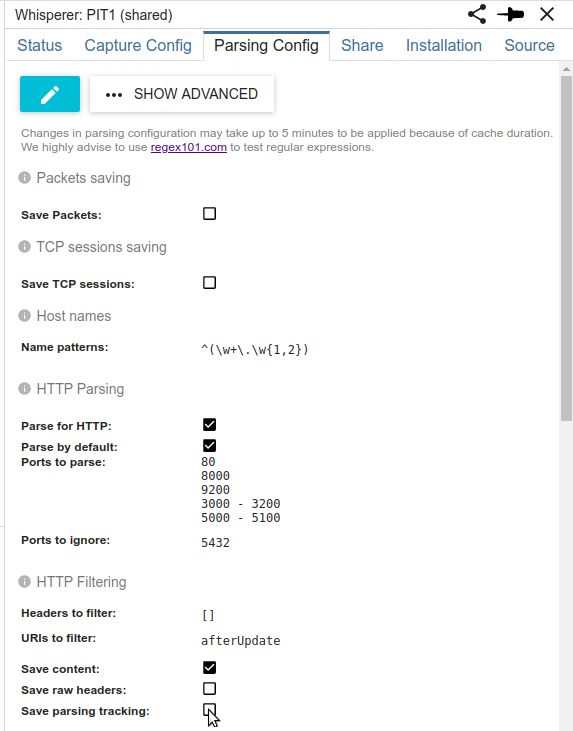
For this, I recently added two new options in Whisperer configuration:
- Save Tcpsessions
- Save Http parsing resources

As for most cases, at least on Streetsmart, we do not work with Tcp sessions and Http parsing resources, there is no use to save them in Elasticsearch.
- These resources are indeed only used to track parsing quality and to troubleshoot specific errors.
- These resources are also saved on Elasticsearch for recovery on errors... but as there are no more errors... it is completely possible to avoid their storage.
I had to change the serialization logic in different places, but after a couple of days, it is now stable and working perfectly :)
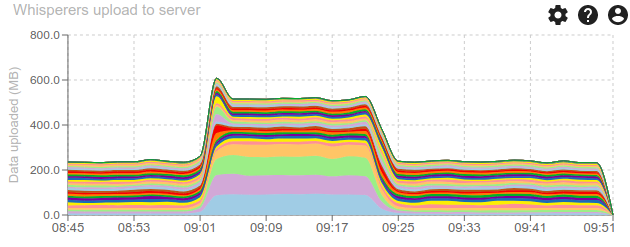
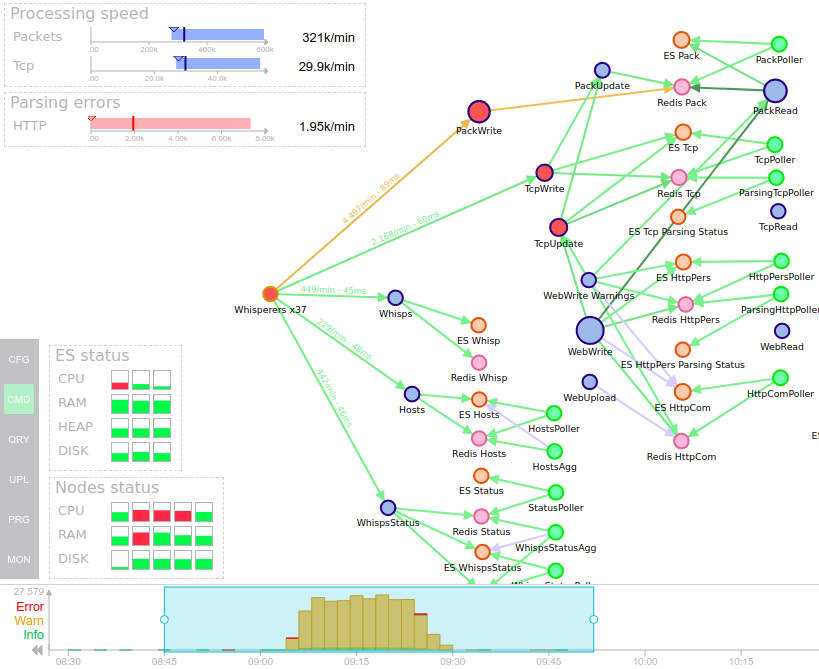
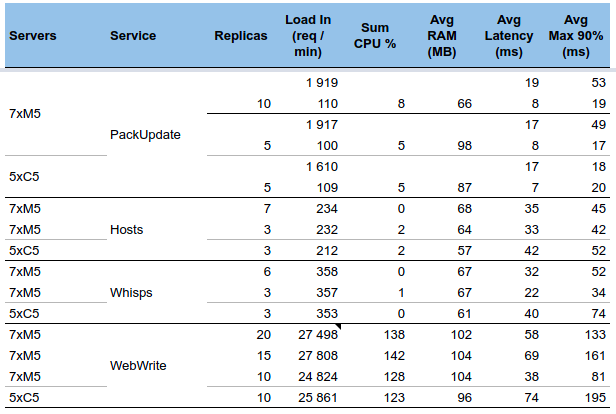
The whole process of packets parsing is then done in memory, in real time and distributed across many web services in the cluster, using only Redis as a temporary store, moving around 300 000 packets by minute 24h/24, amounting to almost 100MB par minute!
That's beautiful =)
- Less storage cost
- Less CPU cost for Elasticsearch indexation
- More availability for Elasticsearch on the UI searches :-) You must have noticed less timeouts these days?
On UI, when these resources are not available, their hypermedia links are not shown. And a new warning is displayed when moving to TCP / Packet view:

Currently, Tcp sessions and Packets are only saved on SIT1 and PRM Integration platforms. For... non regression ;)
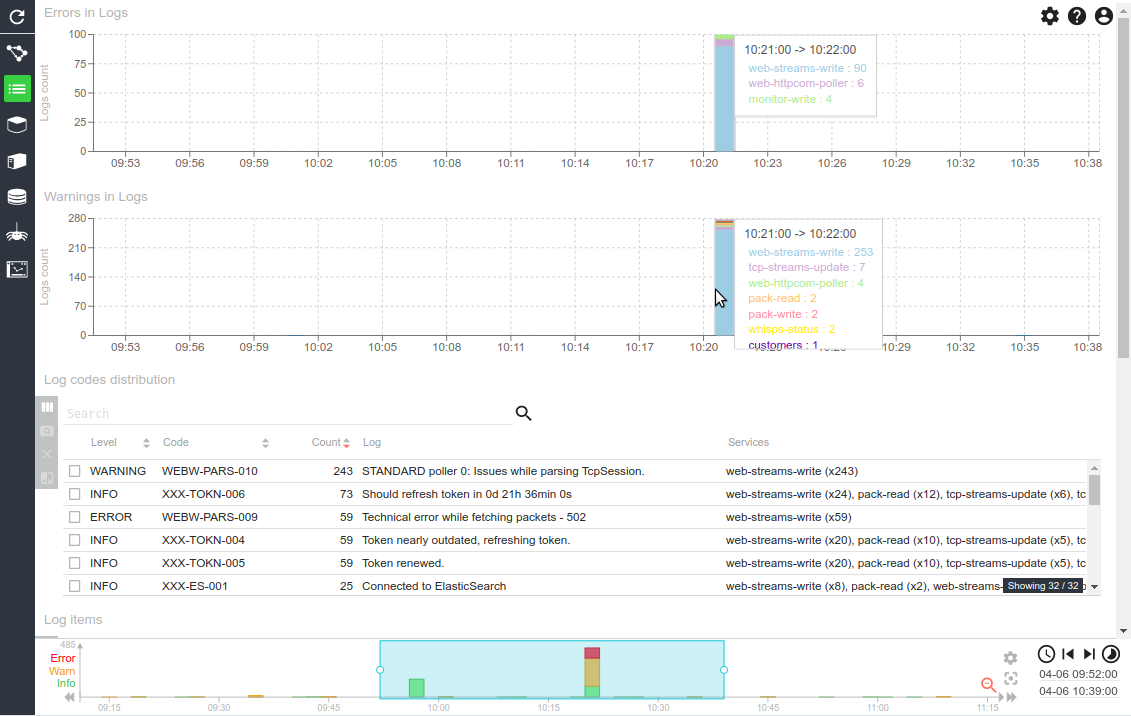
Those resources where rolled up in Elasticsearch to provide information for the parsing quality line at the bottom of the timeline. :-/
As I got this evolution idea AFTER the quality line implementation, I have nothing to replace it yet. So I designed a new way to save parsing quality information during the parsing, in a pre-aggregated format. Development will start soon!
It is important for transparency as well as non regression checks.

