Sequence diagram
Concept
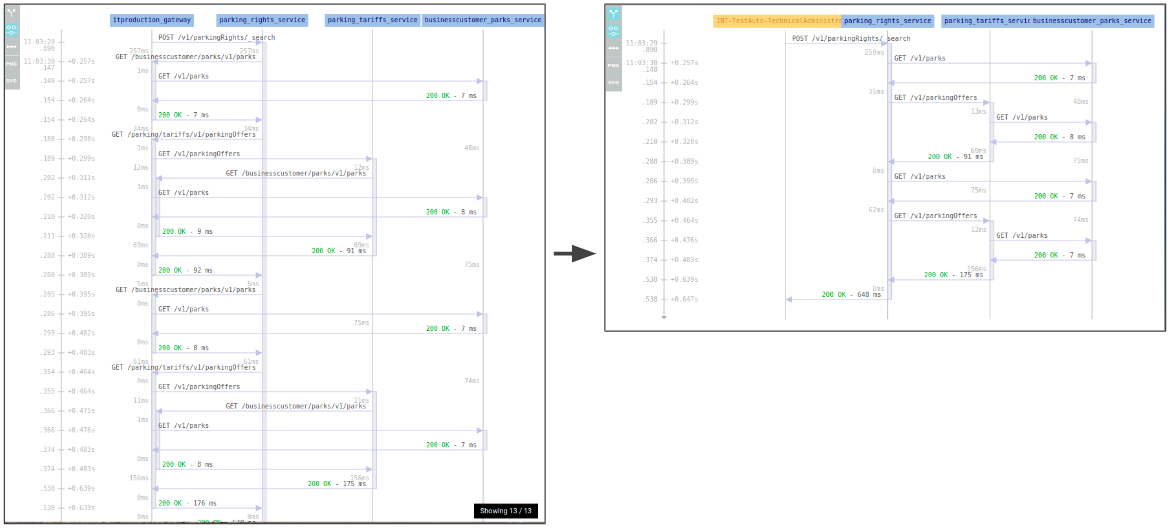
The sequence diagram displays the sequence of calls and how they interact together.
It:
- Shows the calls sequence
- Shows their hosts and target
- Compute the duration in between
- Guess the computation time
It gives an understanding than neither map nor grid can bring.
Typical use cases:
- Understanding call flows
- Optimisation of processing
- Troubleshooting of parallel processing
It is completely dynamic based on current selection, and builds while scrolling down.
Layout
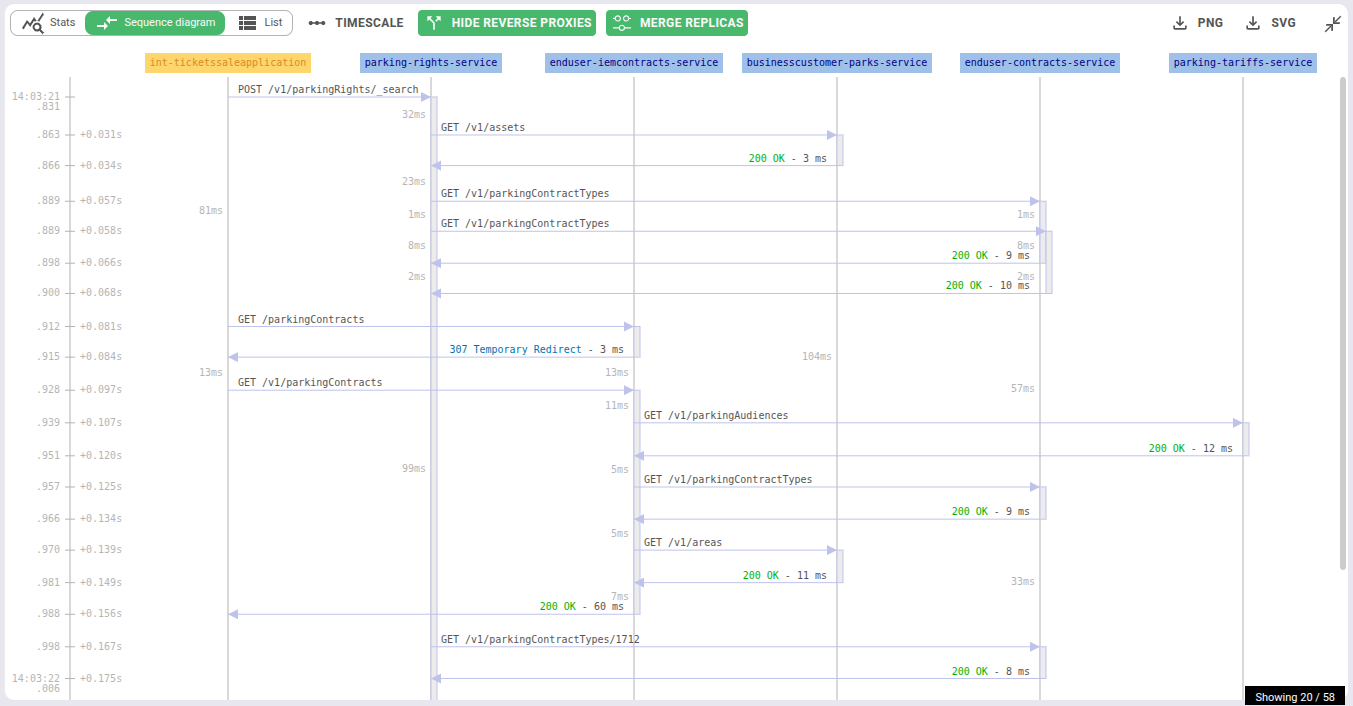
When clicking on a flow, it opens the related communication item in the details panel.
Highlights
The sequence diagram features several tricks to help you read it:
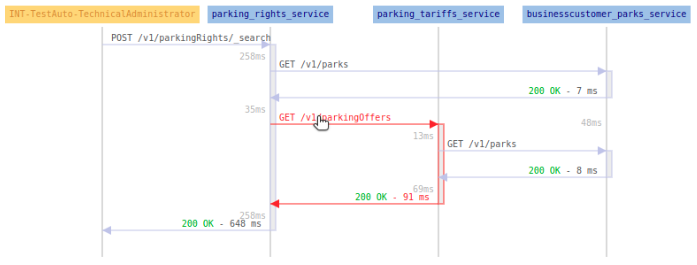
Hover on a flow
Hover on a flow, and the flow is highlighted to show related request and response.
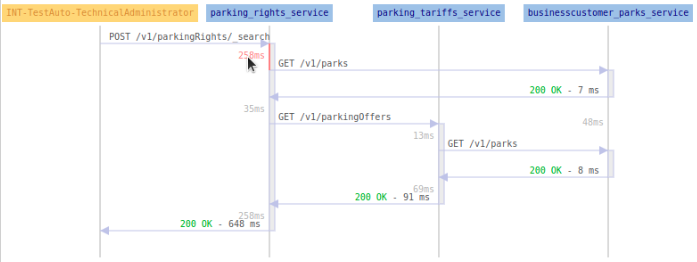
Hover on a delay
Hover on a delay, and the delay span is highlighted to show you start and stop.
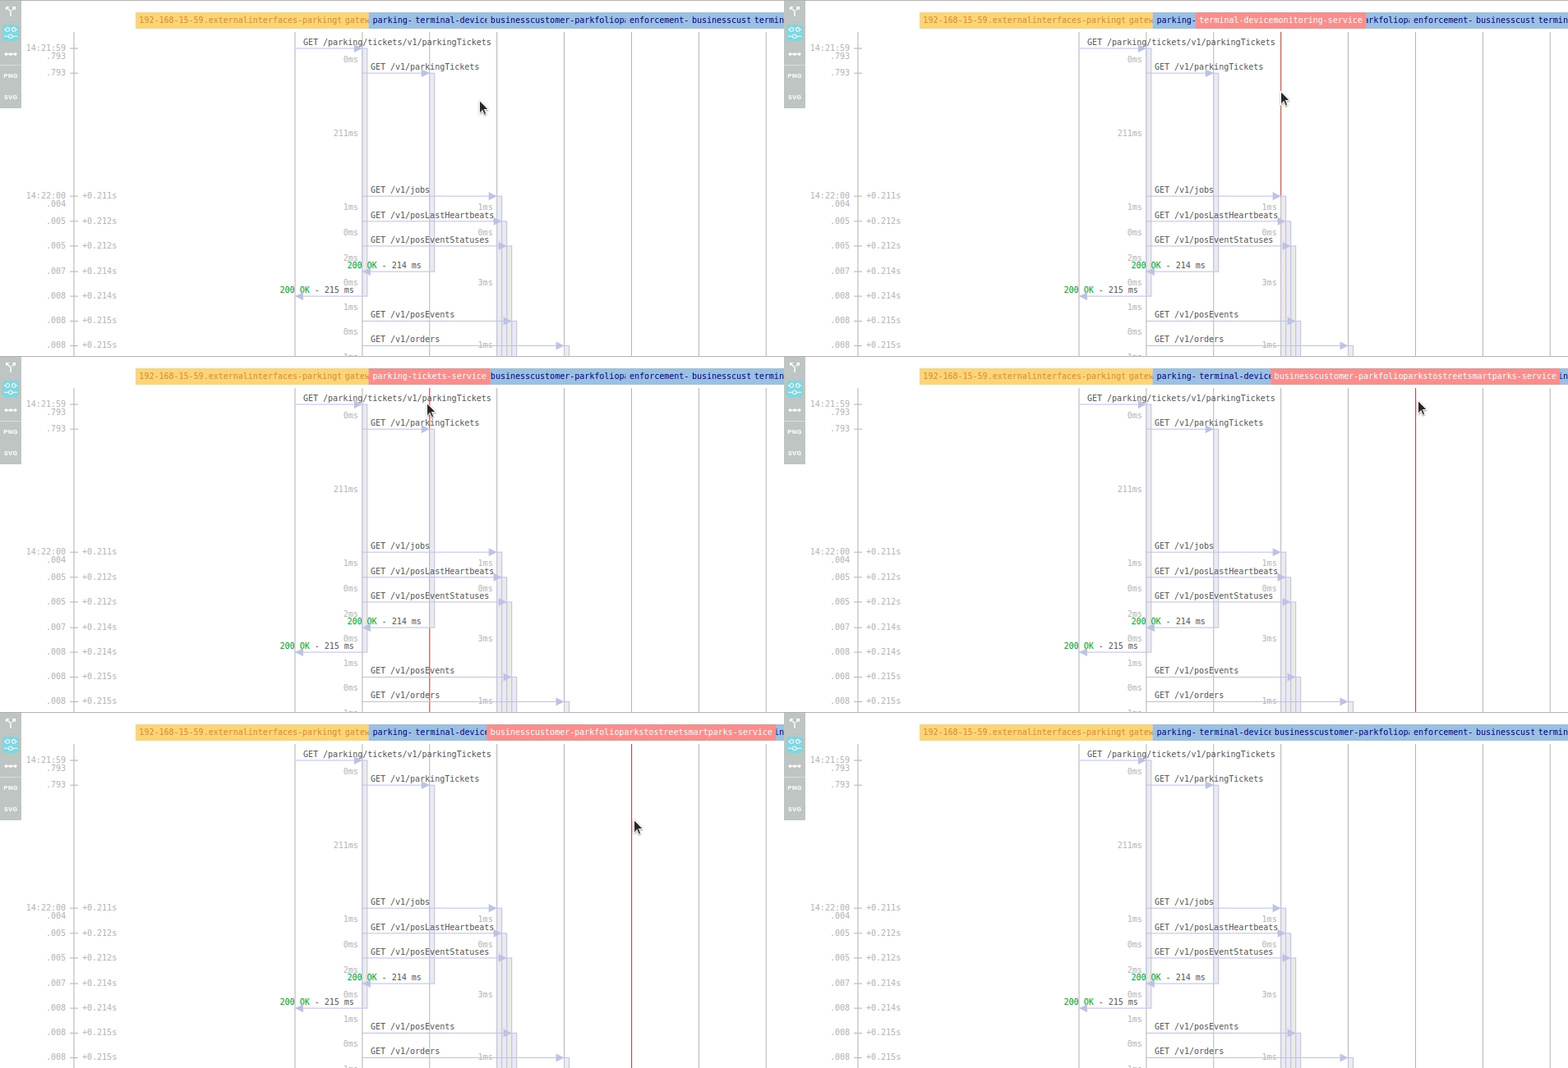
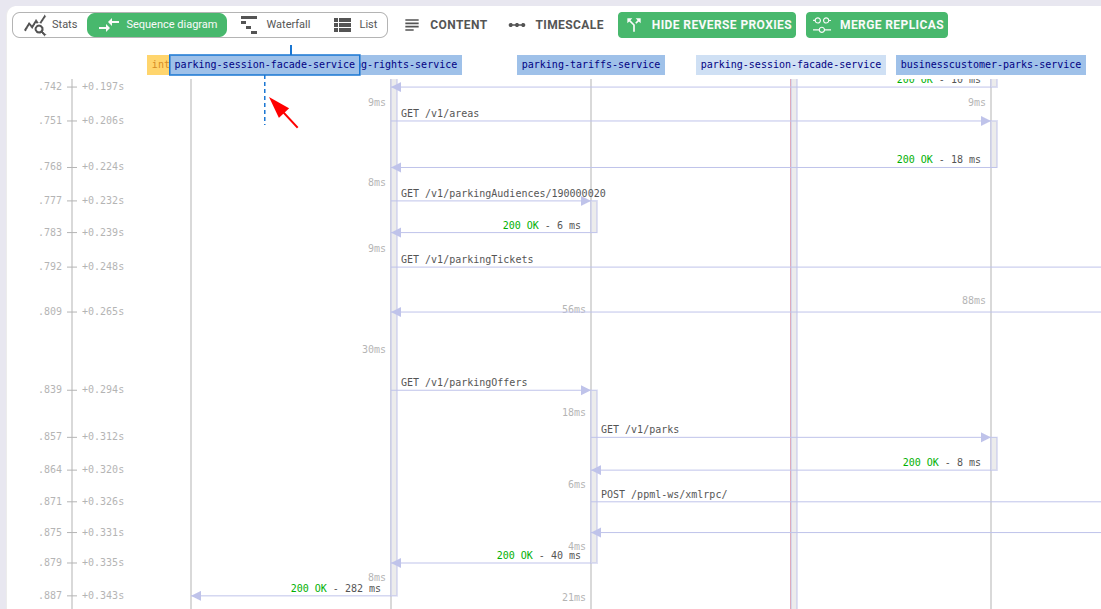
Hover on the vertical lines / headers
The host header is highlighted and raised over the others.
This allows seeing the host name even in case when they overlap one another.
Scale
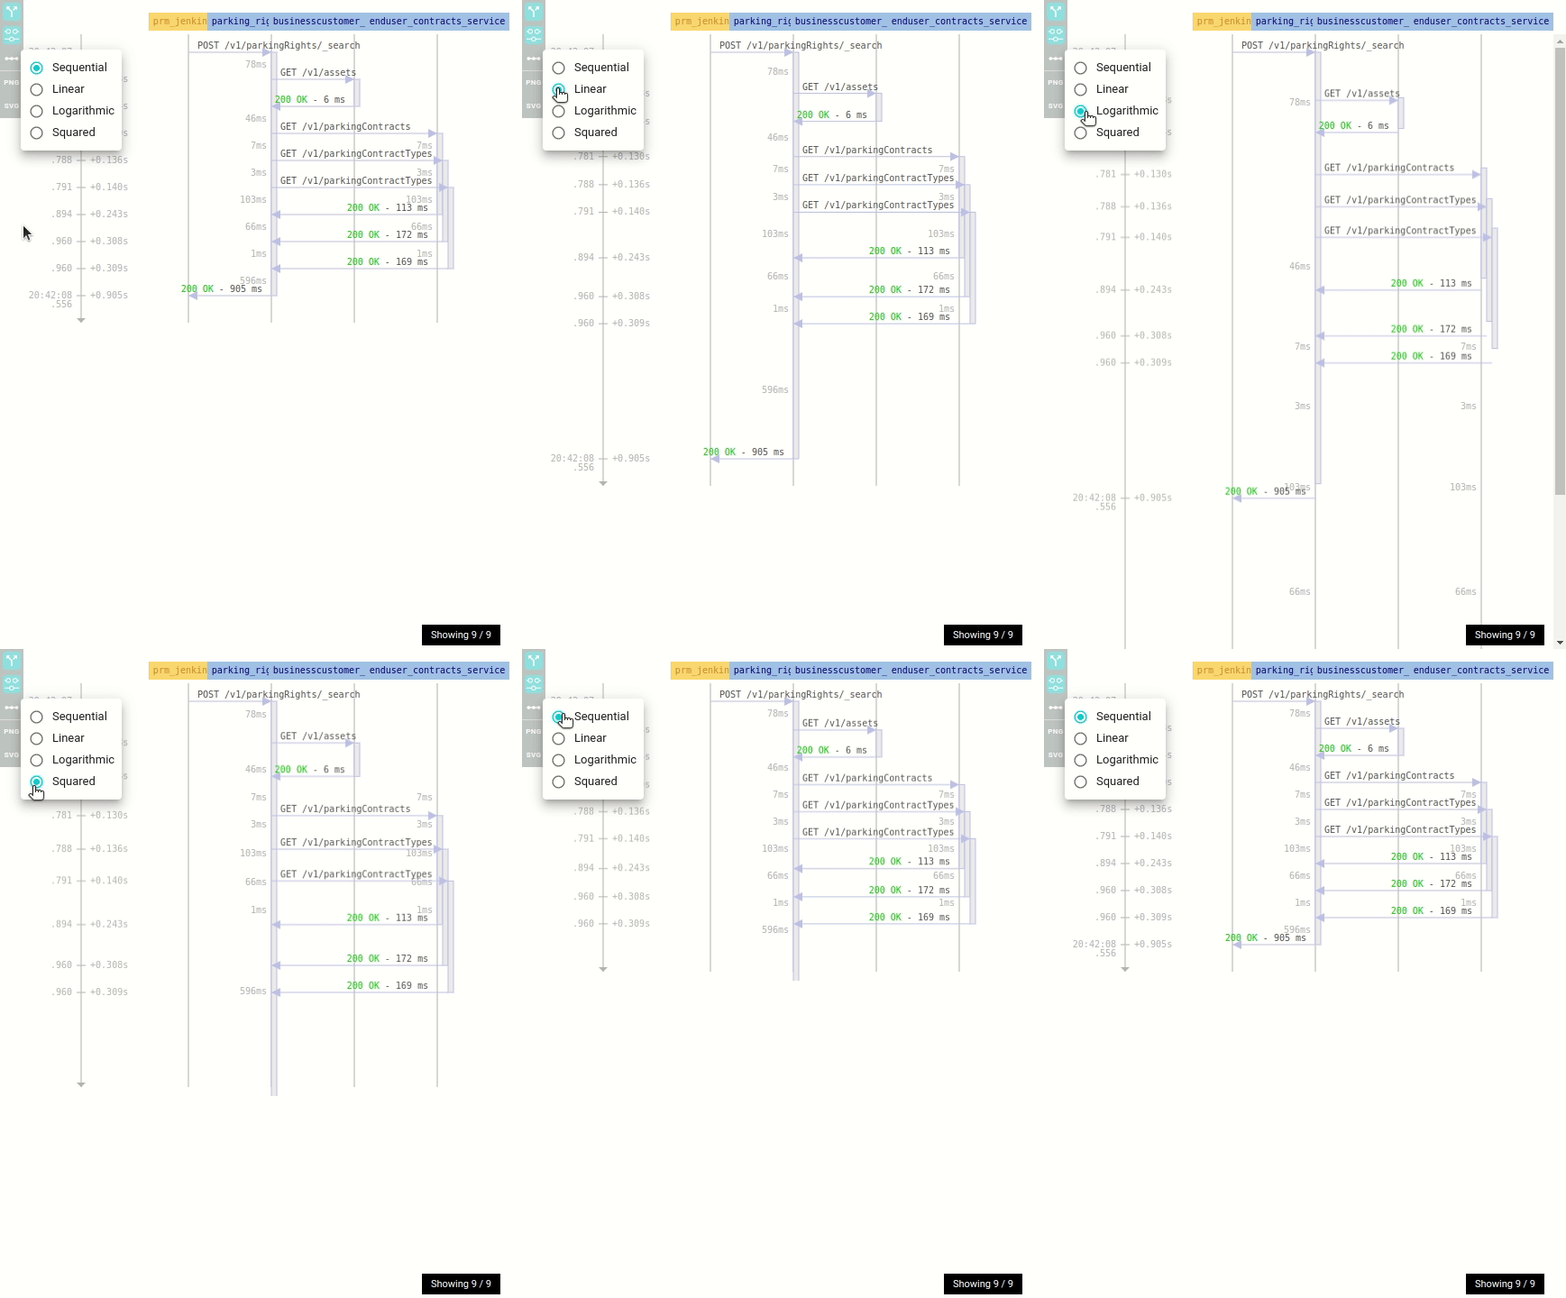
You may change the timescale of the sequence diagram.
It changes the way the durations of calls and between calls are displayed:
| Scale | Description |
|---|---|
| Sequential | Requests and responses are one after another without taking duration into account |
| Linear | Space between calls are linearly proportional of duration (with a min and a max) |
| Logarithmic | Small durations are emphasized |
| Squared | Big durations are emphasised |
Reordering actors
Actors can be dragged left and right to reorder them. When the default order does not match the narrative you want to tell - client on the left, database on the right, gateway in the middle - you can rearrange without leaving the view.
Actor identity
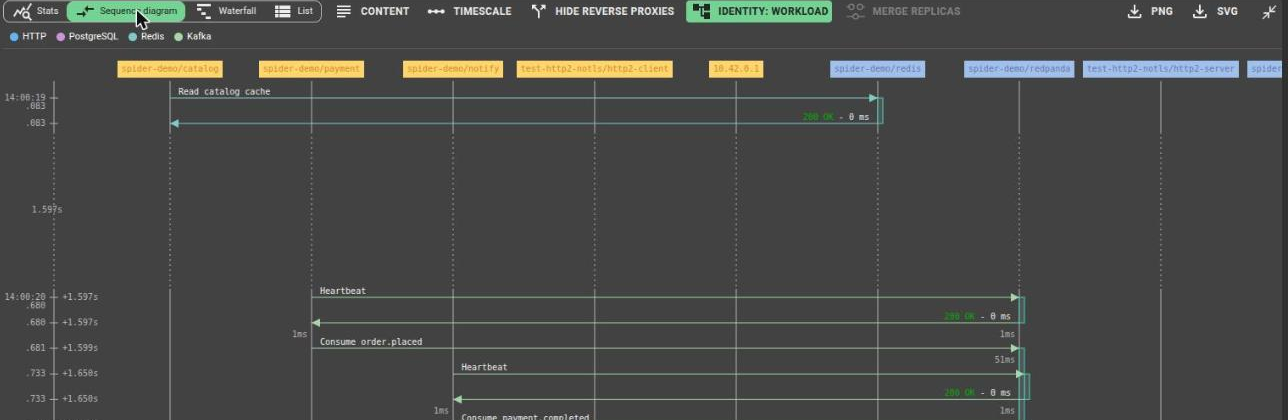
Actors (the vertical lifelines) are labelled by IP or hostname by default. When Spider resolved a Kubernetes
workload for an endpoint, the Identity control lets you identify actors by it instead: IP address,
Workload or Instance - the same three values as the
Network Capture map's Group by, applied here to actors
rather than map nodes.
In Workload or Instance mode:
- Every packet, session or call from the replicas of one workload collapses onto a single lifeline - twenty pods of the same deployment read as one actor, not twenty
- Clicking an actor's header filters on that workload, the same as clicking a host does in
IP addressmode - Merge replicas is disabled: a grouped lifeline already reflects real Kubernetes ownership, so a name pattern has nothing left to add
An endpoint Spider could not resolve to a workload still gets a lifeline - labelled Unresolved - rather
than being dropped from the diagram.
View options
Hide Reverse Proxies
On HTTP view Displays the origin of the call instead of the real source, by hiding the reverse proxies
Merge replicas
On all views, it merges replicas of the same server / service Based on Merging pattern defined in settings, and applied to server FQDN
Disabled while actors are identified by Workload or Instance - see Actor identity above.
Template
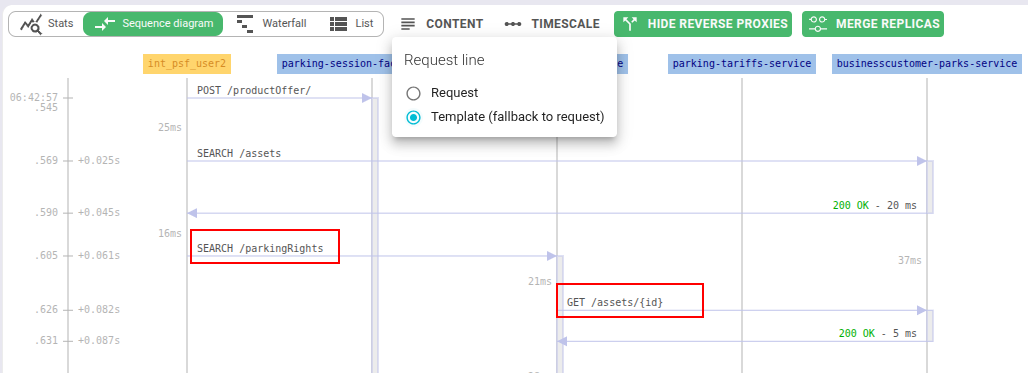
A Template display option overlays the matched template name on each request arrow, alongside the method and URI. Useful when you have many similar routes and want to read the logical operation name rather than the raw path.
Effects
Horizontal scroll
Diagrams with many actors scroll horizontally, so all actors remain accessible regardless of how wide the cast is.
Export
You may export the diagram to .svg or .png formats.
The svg export file may be edited in tools like Inkscape.
You may then use the real flow for your own documentation.