Grid
Concept
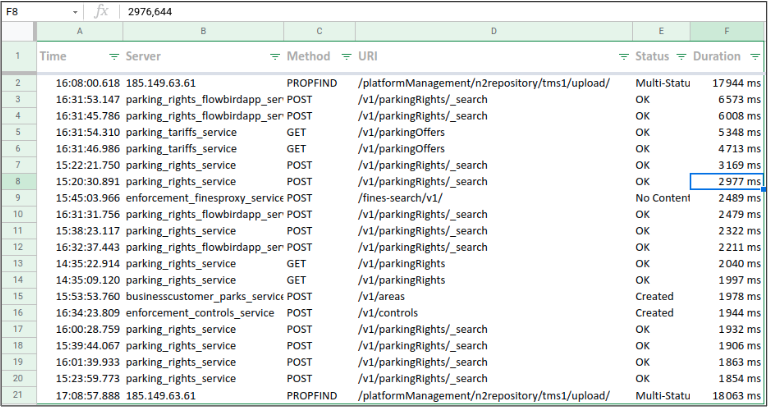
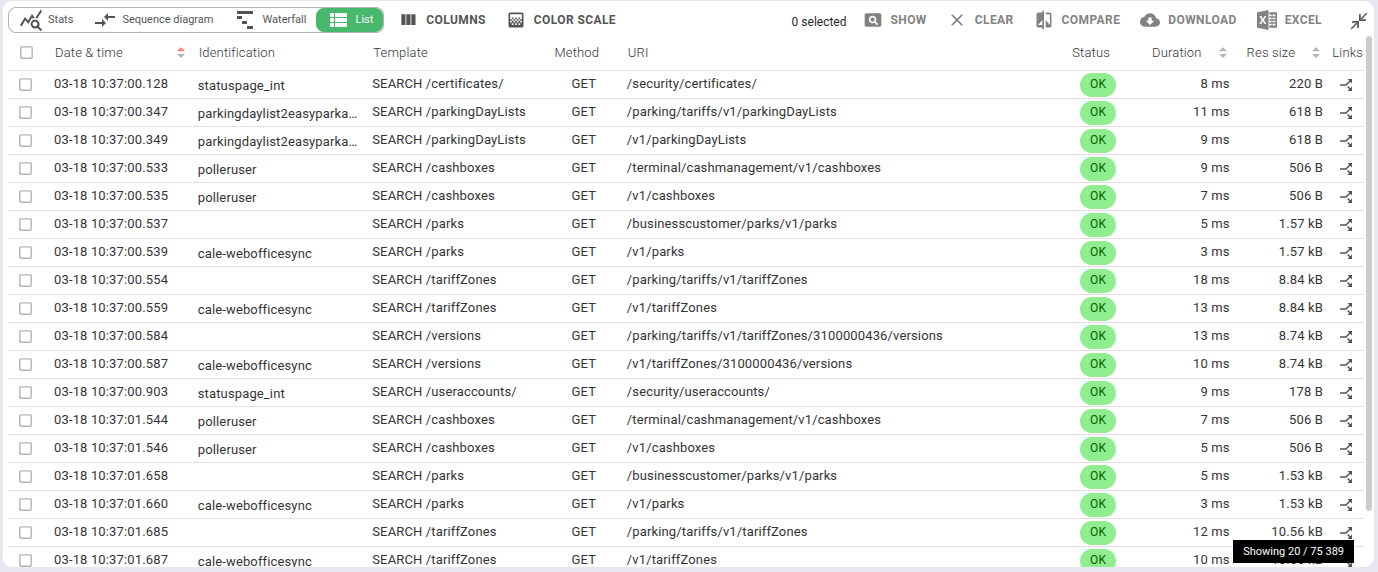
The Grid is a dynamic and customizable grid listing all communications matching your filters.
You may:
- Select the data to show
- Resize columns to see better
- Reorder columns
- Filter & sort on data
- Open unitary communications
- Select and add coms throughout your searches (as a shopping basket)
- Compare two or more coms
- Export selected coms in Excel or JSON
The grid uses infinite scroll for pagination
- Use filtering rather than scrolling down ;-)
Layout
Columns selection and ordering
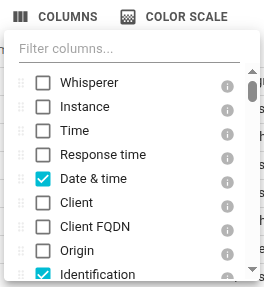
The Select columns icon opens the columns selection popin.
You may:
- Search for a column
- Select what columns to display
- A tooltip explains what is the data displayed for almost each column
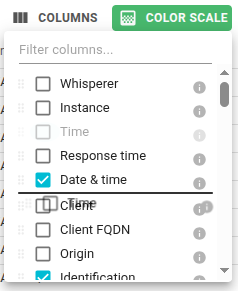
- Reorder columns by dragging them up or down in the list
Some columns may be disabled:
- They are displaying extracted tag values, count or cardinality
- But those tags are not extracted on all Whisperers
- If you have selected such a column to display before, it will appear in your list, but disabled on Whisperers not extracting this tag
- This avoids messy behaviors when reordering columns
The Links column
A narrow Links column sits in every grid - HTTP, gRPC, PostgreSQL, MySQL, Redis, Kafka and the unified All view - and is
visible by default.
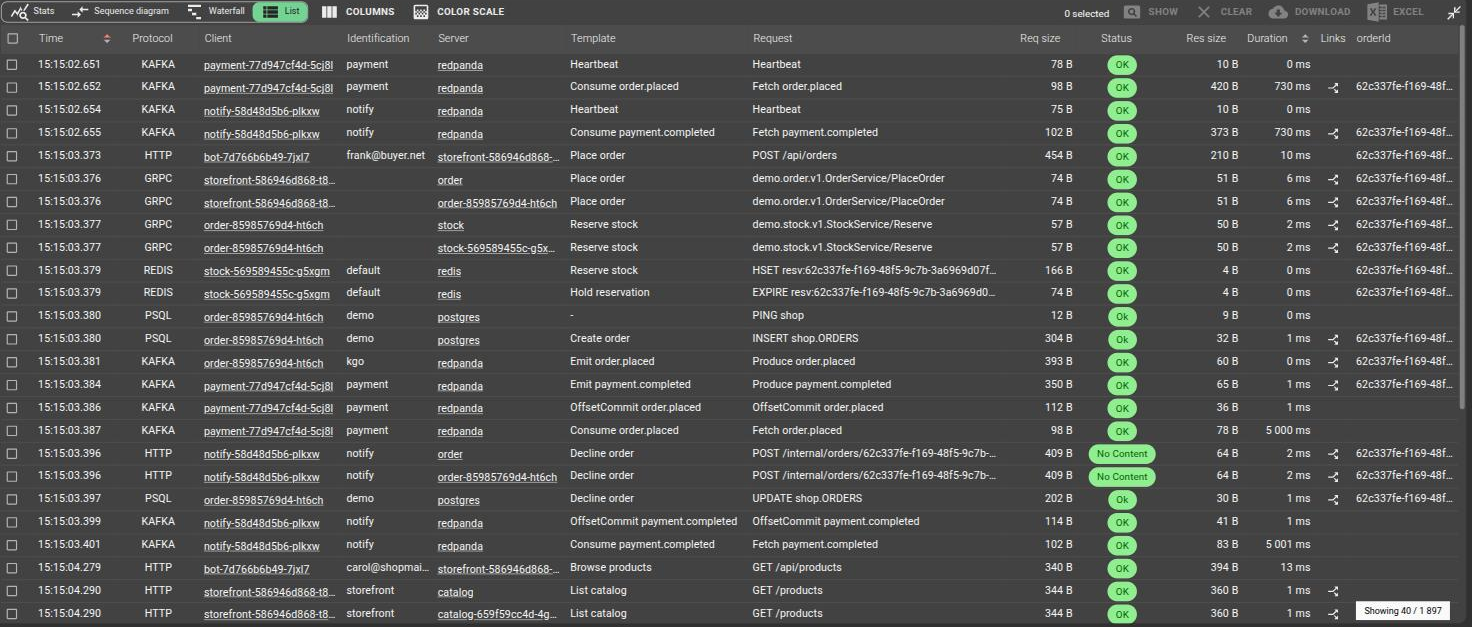
Above, in the All view: the button appears on every communication carrying a correlation tag, whatever the
protocol, and is simply absent on the ones that carry none - here the Kafka Heartbeat rows.
It shows a button only on communications carrying a correlation tag, and nothing at all on the others, so a grid with no correlation tags costs you one narrow empty column:
Click- the whole chain in the All view.Shift + Click- the same chain as a sequence diagram.
Both gestures leave for All by design: a chain crosses protocols, so staying inside the collection you started from would only ever show you part of it. Hovering the button names the tags that actually matched on that row.
Which tags earn the button is the Correlation setting in the Global settings tab.
It defaults to correlationId, which Whisperers extract from traceparent, X-Request-ID and X-Correlation-ID
with nothing configured.
Workload columns
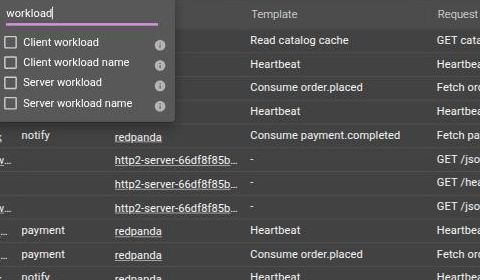
Every grid with client/server endpoints - HTTP, PSQL, MySQL, Redis, gRPC, Kafka, MQTT, MongoDB, TCP sessions and packets - gains seven columns per endpoint: workload, namespace, kind, workload name, cluster node, instance and resolution tier. HTTP adds the same set again for the request's origin.
They all ship hidden by default, so existing grids and saved column layouts are unchanged. Open
Columns selection and search "workload" to add them. The same fields drive
the Clients / Servers filter bands and the
detail views' From / To lines.
Color scale on numeric columns
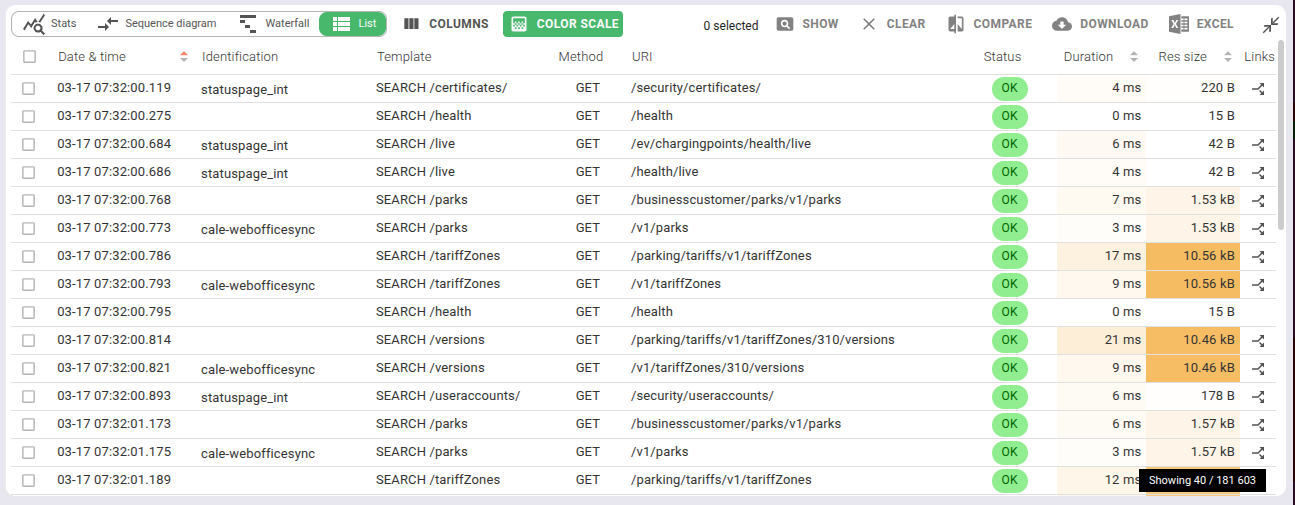
Any numeric column - duration, size, row count, error count - can render a background color scale. The cell color is proportional to the column's value range: the highest value gets the darkest shade, zero gets none.
This turns a plain table into a heat map with no configuration. Outliers jump out without sorting or filtering first.
Selecting records
In the grid, yuu may select records in order to:
- Compare records
- Export records to Excel
Records selection is independent of search or view changes:
- Search
- Browse for records
- Select them
- Search again
- Find other records
- Select them
- Click to see only selected items
- And then view, compare or export them
Filters
The list offers easy access to filters in the header.
Those filters are exactly the same as elsewhere in Spider. Only faster to access.
- The filter icon appear when moving the mouse over the header.
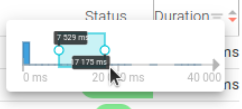
- On click, a popin shows the values list or the distribution histogram.
Items filter
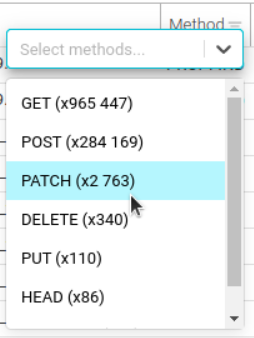
Range filter
Records export
Export formats

You may export the selection in two formats:
-
Download in JSON- Complete content in JSON format- Useful to import it back in an upload Whisperer later or in another platform
- Used by integration teams to save integration campaigns
- See OpenAPI format description
-
Excel- Only visible data columns- Useful to export in a report
How to
- Select all lines to export
- Click the export button
- The file is generated in your browser and triggered for download
Excel content
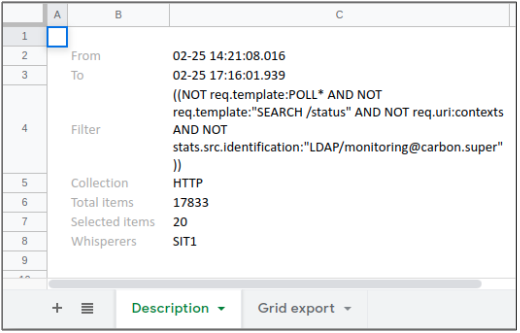
Excel export includes a header sheet and the data sheet.
- Time selection
- Selected Whisperers
- Current view
- Current filters
- Total items matching the filters
- Count of exported items
Excel export is meant to be usable straight: all formatting is done for you
- Autofilter is on
- Dates are exported as Excel dates and formatted as in UI
- Numbers are exported as numbers, but displayed with specific formats