Hosts
Concept
The host detailed view represent a service or a client and shows its interactions and some major statistics.
Access
You may open the host details:
- from the map tooltips
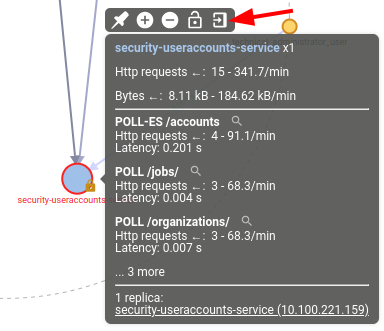
- or from any host name representation: in the grid, in communication details, in the dashboard...

When you open the details of a merged host, Spider will open all hosts details as different tabs.
Content
Screenshot
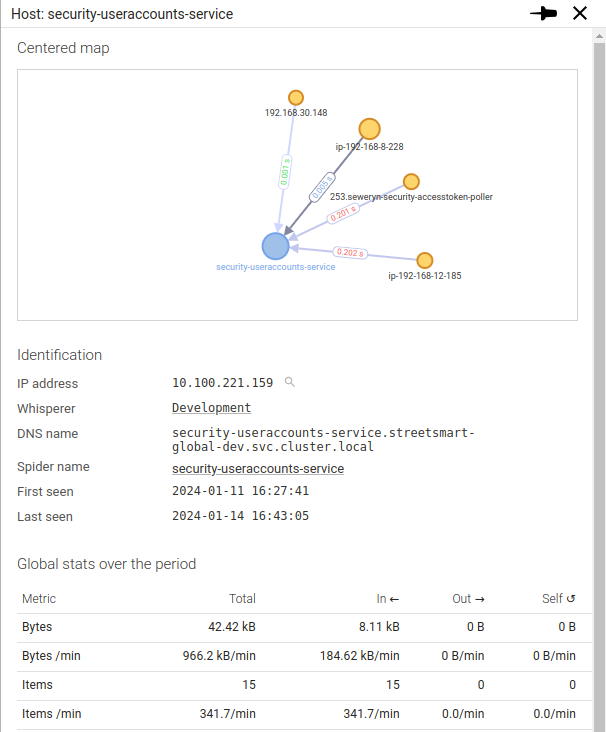
Map
The map is centered on the host and shows the various host it interacts with.
It offers the same features as the top panel map.
Identification
| Field | Description |
|---|---|
| IP address | IP address of the host |
| Whisperer | Whisperer that captured it |
| DNS name | The name as given by the DNS |
| Spider name | The name as shortened on capture, or renamed on it |
| First seen | The date this Whisperer has first seen the host |
| Last seen | The date it has last seen it |
Workload

The hosts index carries no workload field of its own - a host is an IP, and the same IP can belong to different Kubernetes workloads over its lifetime. So this section is not a lookup: it is aggregated back out of the traffic captured for this host over the selected time span.
Each line reads workload · role · resolved by <tier> · count:
- Workload - the Kubernetes workload seen behind this IP
- Role -
clientorserver - Resolution - the tier Spider resolved it at (
workload,dns,cidrorip) - Count - number of communications seen with that workload, in that role
More than one line for the same role is expected, not an error: when an IP was reused by different pods over the window, every workload that used it appears with its own count.
The section hides itself entirely when the current view carries no workload fields.
Global stats
It shows, for selected protocol, some statistics on bytes and items exchanged during the selected time.
It gives raw count and load (speed).
| Column | Description |
|---|---|
| Total | In + Out + Self - Includes headers |
| In | Payload received |
| Out | Payload sent |
| Self | Payload exchanged with itself |
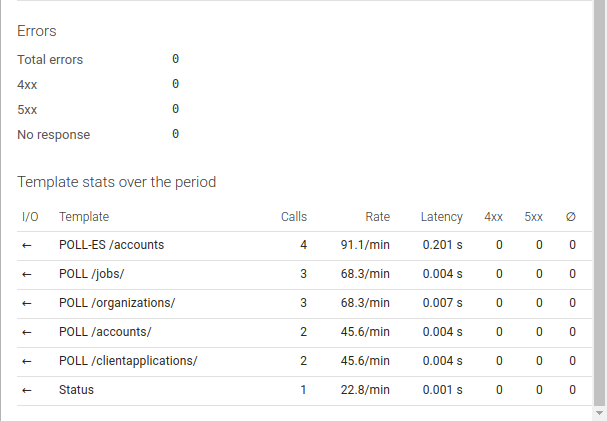
Errors (for HTTP view)
Gives a summary of errors during the period.
| Line | Description |
|---|---|
| Total errors | Sum of all errors |
| 4xx | Responses with status between 400 and 499 |
| 5xx | Responses with status between 500 and 599 |
| No response | When the server did not answer |
Template stats
Gives statistics for the HTTP templates (API) over the period.
| Column | Description |
|---|---|
| I/O | Show the API call direction: In or Out |
| Template | Name of th template |
| Calls | Count of calls |
| Rate | Load of requests on this API |
| Latency | Average latency |
| 4xx | 4xx errors |
| 5xx | 5xx errors |
| Empty | No response |