gRPC communications
Concept
A gRPC communication is a single Remote Procedure Call carried over gRPC-over-HTTP/2, decoded from the HTTP/2 frames of a TCP session. Each call maps to one HTTP/2 stream: its request message(s), its response message(s), the call metadata (HTTP/2 headers and trailers) and the final gRPC status.
Each gRPC communication is associated with:
- Source and destination IP address
- Source and destination TCP port
- The fully-qualified method called, split into its
service(e.g.echo.Echo) andmethod(e.g.Ping) - The kind of call:
unary- one request message, one response messageserver-stream- one request, a stream of responsesclient-stream- a stream of requests, one responsebidi- a stream of requests and a stream of responsesmisc- a stream whose shape could not be classified
- The request and response metadata (HTTP/2 headers / trailers)
- The final gRPC status (
OK,NOT_FOUND,UNAVAILABLE…) and message - The protobuf message(s) carried by the request and the response, optionally transcoded to JSON via a schema binding
gRPC communications are extracted while parsing the TCP sessions in streaming, on the Spider backend. gRPC is almost
always carried over TLS (ALPN h2); the master secrets captured by Gocipher are used to decrypt it before parsing.
A simple unary call is stored as one paired communication (request + response), like an HTTP communication.
A streaming call (server / client / bidi) is exploded into one communication per message, all sharing a
single transactionId (the call id), so the message-centric UI (grid, sequence diagram, waterfall, timeline,
statistics) renders and time-buckets each message individually. Every communication still carries req and res
parts - the message's own side is real, the other side is synthetic (it only carries the fullMethod and a
timestamp) so req.start and req.fullMethod stay searchable on every message. See Transaction.
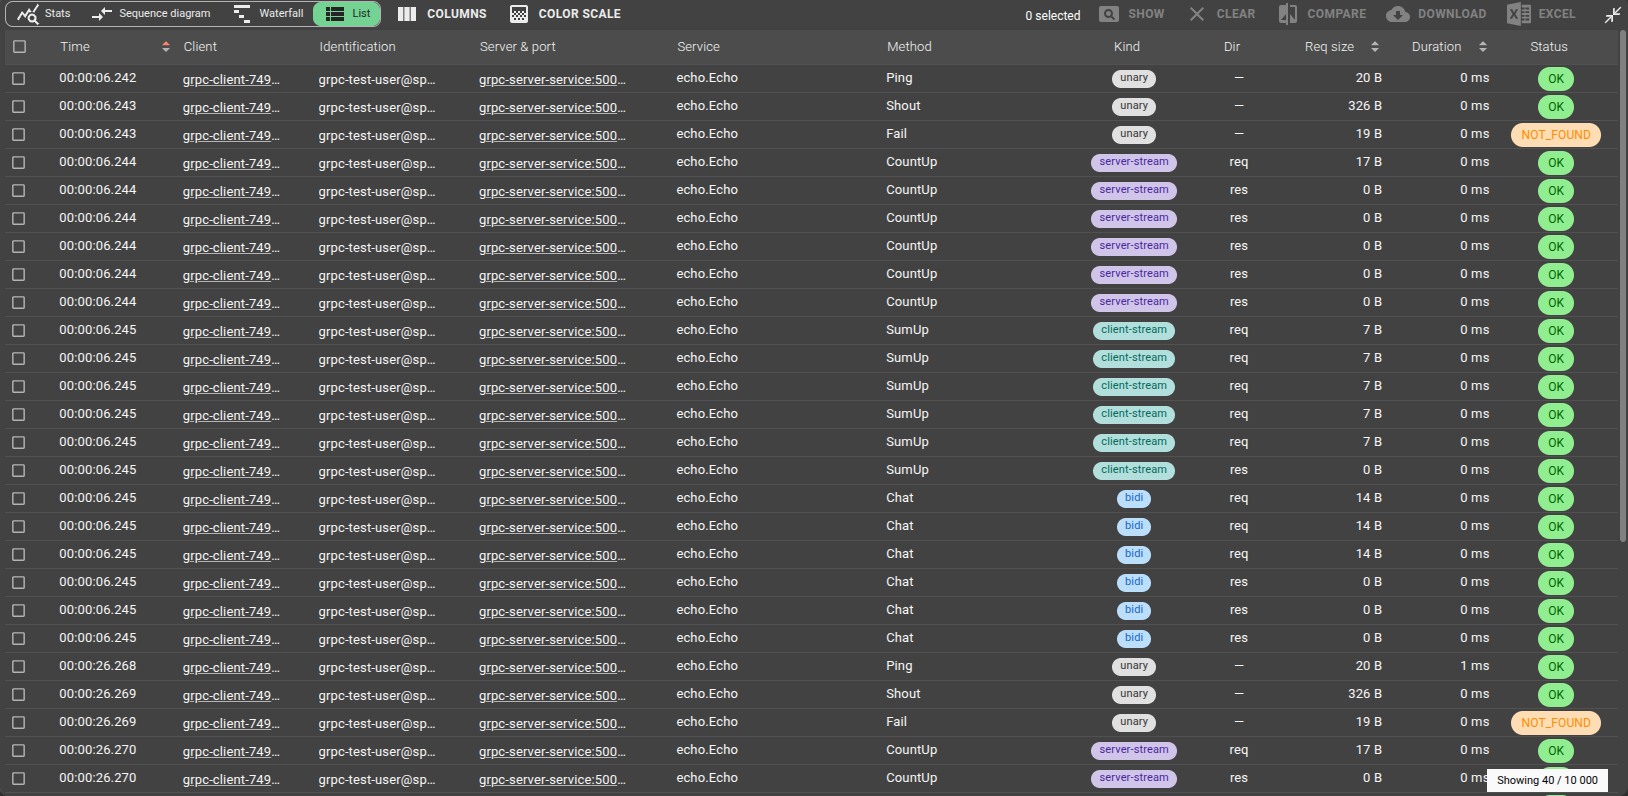
gRPC communications appear in the dedicated gRPC view - grid, timeline, dashboard, sequence diagram, waterfall and statistics. Each streaming message is its own row, grouped by call:
Global Tab
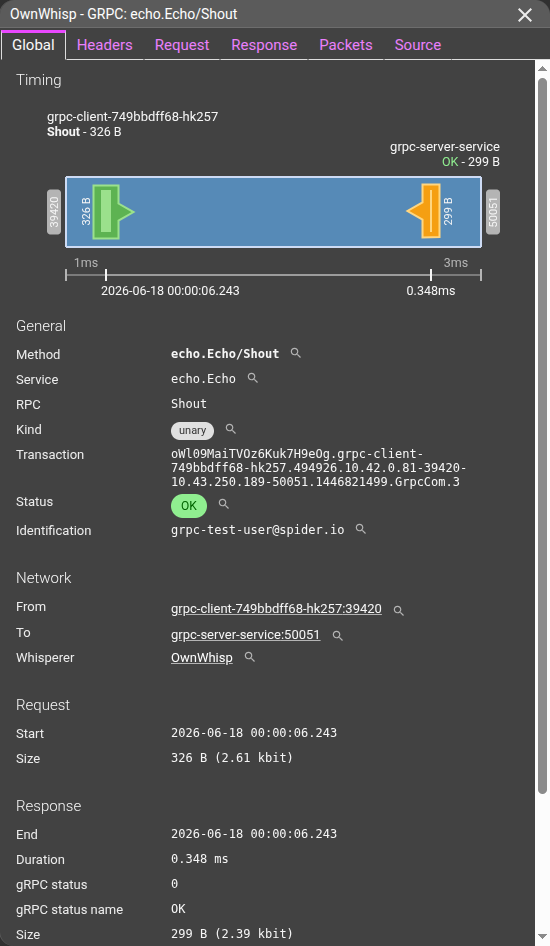
The Global tab summarises the call: timing, identification, network, request, response and Spider info.
Timing
The timing diagram shows the client and server hosts, the request (green) and response (orange) shapes scaled by the
packet timestamps with per-packet markers, the identity line (service/method - size), and the response summary
(gRPC status + size). The gRPC server port (50051 by convention) is labelled with the service.
- The client and server hosts are shown, by order of preference:
- The short name of the Host, as extracted during integration in the backend, or as renamed by a user
- The FQDN of the Host
- The IP address, if no Host found
General
The General section shows identification information:
| Field | Description |
|---|---|
| Method | The fully-qualified method service/method (e.g. echo.Echo/Ping) |
| Service | The gRPC service called (e.g. echo.Echo) |
| RPC | The method called (e.g. Ping) |
| Kind | unary, server-stream, client-stream, bidi or misc |
| Transaction | The call id grouping all per-message communications of a streaming call |
| Status | A computed status, made to match HTTP semantics |
| Identification | The resolved identification of the client |
Spider maps the final gRPC status onto HTTP-like status codes so gRPC communications are comparable with HTTP,
PostgreSQL and Redis ones (e.g. 200 for OK, 404 for NOT_FOUND, 401 / 403 for UNAUTHENTICATED /
PERMISSION_DENIED, 503 for UNAVAILABLE). The original gRPC status code and name are kept on the response.
Request
The Request section shows summary information of the request part:
| Field | Description |
|---|---|
| Start | Date the request started, user's local time |
| End | Date the request ended |
| Messages | Number of request messages |
| Size | Total bytes sent to the server |
Response
The Response section shows summary information of the response part:
| Field | Description |
|---|---|
| Start | Date the response started |
| End | Date the response ended |
| Duration | The difference between request start and response end |
| gRPC status | The final gRPC status code and name (0 / OK, 5 / NOT_FOUND…) |
| gRPC message | The status message returned in the trailers, when any |
| Messages | Number of response messages |
| Size | Total bytes received from the server |
Network
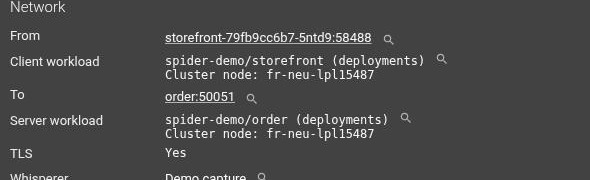
The Network section shows the connection endpoints (From / To) and the Whisperer that captured the call.
When Spider resolved a Kubernetes workload for either endpoint, it appears right beneath it - see
Workload identity.
The call metadata (HTTP/2 headers and trailers) is shown on its own Headers tab.
The request Template (a stable name for recurrent calls, defaulting to the full method) and any extracted Tags
are configured at Whisperer level
and are searchable.
Tags
Tags are a very powerful feature of Spider parsing process.
They are configured at Whisperer level, and allow custom extraction of the data exchanged. They allow searching and aggregating by the extracted values.
Unlike HTTP / Redis tags - which match a regular expression over the exchanged bytes - gRPC tags are field paths. Each tag names a path into a per-side view of the call:
- on the request:
service,method,fullMethod,metadata.<key>ormessage.<field.path>(into the decoded protobuf message) - on the response:
grpcStatus,grpcStatusName,grpcMessage,metadata.<key>ormessage.<field.path>
This makes message-field extraction exact (no regex over binary), at the cost of needing a schema
binding to reach message.* paths.
Tags may be enriched / decoded by a plugin.
For instance:
- To translate internal identifiers from a message field into their business names
- With a link to open them in the application under observation
Transaction
A streaming call (server / client / bidi) is stored as one communication per message; a Transaction line links all
those messages together through a shared transactionId, so you can follow the whole streaming call at once. Each
streaming-message communication carries a direction (req / res), a 0-based index within its direction, and a
terminal flag on the last response (which also carries the final gRPC status). A unary call is its own transaction
(transactionId equals its @id, with no direction / index).
Spider info
This section shows Spider own information:
| Field | Description |
|---|---|
| Whisperer | Name and link to the Whisperer |
| Instance | Instance of the Whisperer that captured the communication |
| Tcp session | Tcp session id and link |
| Request parsing | Parsing status of the request |
| Response parsing | Parsing status of the response |
Actions
For messages from streaming communications, you may access the full streaming flow by clicking on the View full stream
button. It opens the whole call - all of its messages, grouped by transactionId - in the dedicated
Transaction view. The button only appears on a streaming message (one that carries a
direction); a unary call is its own transaction, so there is nothing extra to open.
Headers tab
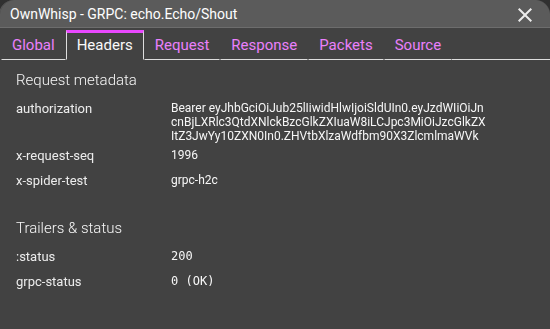
The Headers tab shows the call metadata: the Request metadata (HTTP/2 request headers) and the Trailers & status
(HTTP/2 response trailers, including the :status and the grpc-status).
Request tab
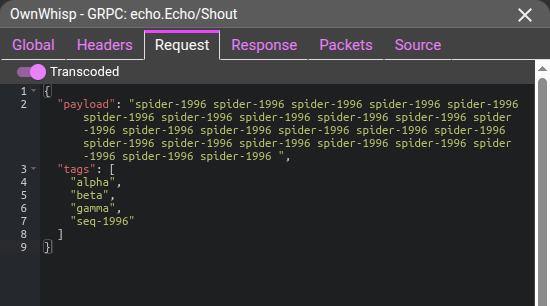
The Request tab shows the protobuf message(s) sent by the client.
Each message is shown in an indexed message table - one row per message. A toggle switches between the raw bytes
and the transcoded JSON form when a schema binding matches the call's (service, method).
Response tab
The Response tab shows the protobuf message(s) returned by the server, with the final gRPC status.
Streaming responses are shown in the same indexed message table - one row per message - with the same raw ↔ transcoded toggle.
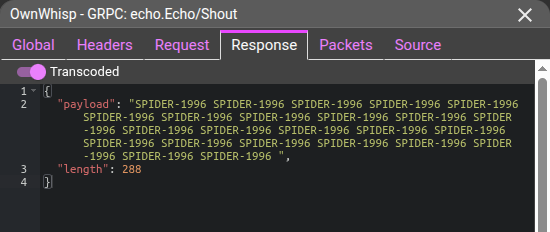
Transcoded view
When a content schema is bound to a
(service, method) pair, Spider transcodes the matching request and response messages from their binary protobuf
form to searchable JSON. The message table then defaults to the Transcoded view, and falls back to Raw with
a banner when the binding misses or decoding fails. The request and response sides are bound independently. Tags and
templates can extract from the JSON form of transcoded messages.
Transaction view
A streaming call (server / client / bidi) is exploded into one communication per message, so the grid shows each
message on its own row. To follow the whole call at once, open the Transaction view: from any streaming
message, go to its Global tab and click View full stream (see Actions). The view is
titled gRPC call: <fullMethod> and gathers every message sharing the same transactionId, ordered by their
absolute position in the stream.
It has three tabs: Global, Flow and Source.
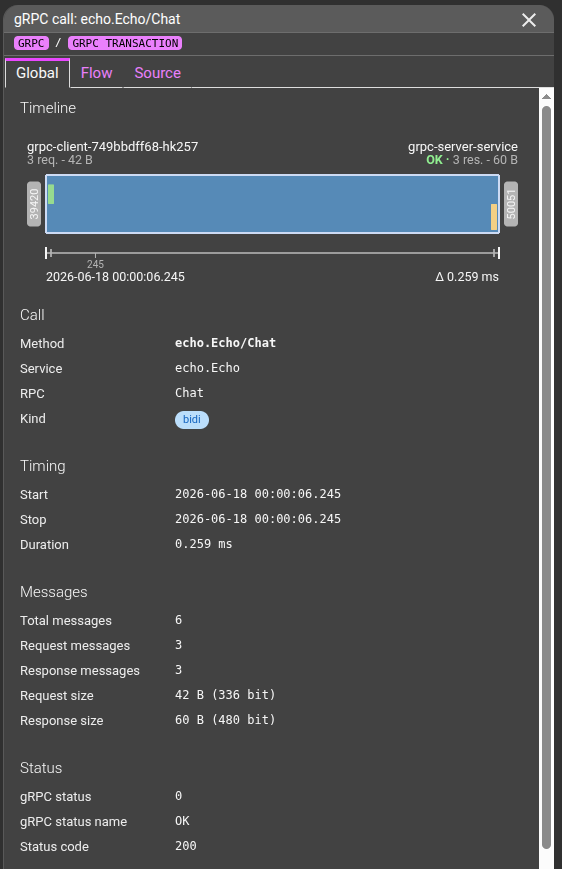
Transaction - Global tab
The Global tab summarises the whole call (not a single message), with a compact timeline of all its messages
and the following sections:
| Section | Fields |
|---|---|
| Call | Method (service/method), Service, RPC, Kind (unary / server-stream / client-stream / bidi) |
| Timing | Start (first message), Stop (last message) and Duration of the whole call |
| Messages | Total messages, Request messages, Response messages, Request size, Response size |
| Status | The final gRPC status code and name, the gRPC message, and the HTTP-mapped status code |
| Spider info | The Whisperer, the Tcp session and the Transaction id |
Transaction - Flow tab
The Flow tab renders the call as a time-aligned, chat-style flow of its messages - the natural way to read a
streaming conversation:
- A compact timeline header shows every message as a bar (request above the centerline, response below), sized by payload, with a scroll-synced cursor window marking which messages are currently visible in the flow below.
- The client and server endpoints are shown on the left and right.
- Each message is a card, laid out chat-style (requests to the left, responses to the right), showing:
- its direction and index (
Req #0,Res #3…), its timestamp, and - on the terminal response - aterminalmarker and the final gRPC status, - the message payload size, and an icon to open that individual message in its own detail view,
- the message content in a coloured block (green for a request, orange for a response): the transcoded protobuf when a schema binding matches, falling back to the raw bytes otherwise (truncated for very large messages),
- the inter-message delay (
∆ <n> ms) from the previous message, when any.
- its direction and index (
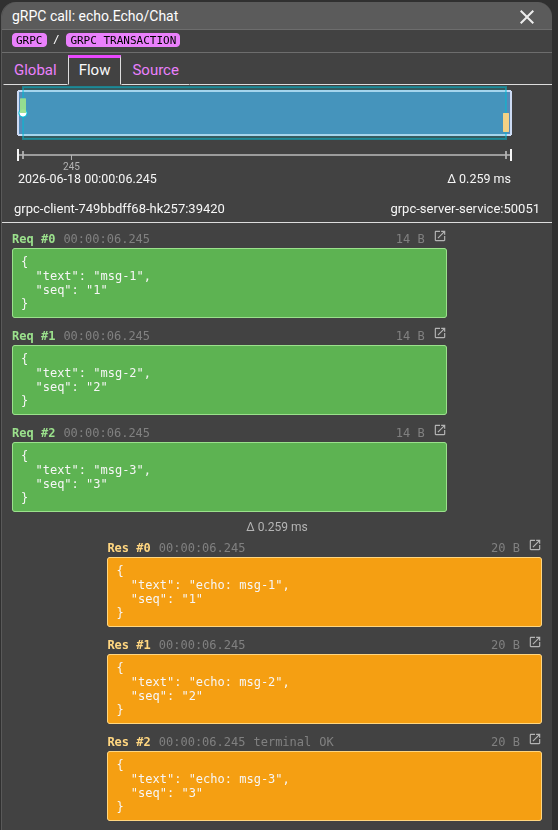
Message contents are fetched lazily as you scroll, so even long streams open quickly.
Transaction - Source tab
The Source tab shows the raw JSON of the transaction: the call summary object together with the array of all its
per-message communications.
Packets tab
The Packets tab shows the network packets composing the gRPC communication.
You may open them by clicking on the rows.
| Field | Description |
|---|---|
| Dir | Direction of the packet |
| Time | Time the packet was captured |
| Payload | Size of the TCP payload |
| Info | Flags and beginning of TCP payload, in ASCII |
::: note gRPC is almost always carried over TLS, so the packets are encrypted. The only ways to see them decrypted is to access the TCP session, and:
- to read the packets from the beginning, in the
contenttab, - or to export the session in
.pcapngformat (for Wireshark or alike) :::
Source
The Source tab shows the gRPC communication in JSON format.
Below is a sample unary gRPC communication as it is available through the API:
{
    "@id": "oWl09MaiTVOz6Kuk7H9eOg.grpc-server-7c9f8d-q2xkz.494744.10.42.0.67-40122-10.42.0.53-50051.554123633.GrpcCom.5",
    "@type": "GrpcCom",
    "dateModified": "2026-06-18T08:51:35.289+00:00",
    "tcpSession": "oWl09MaiTVOz6Kuk7H9eOg.grpc-server-7c9f8d-q2xkz.494744.10.42.0.67-40122-10.42.0.53-50051.554123633",
    "instanceId": "grpc-server-7c9f8d-q2xkz",
    "name": "554123633.10.42.0.67-40122-10.42.0.53-50051.GrpcCom",
    "whisperer": "oWl09MaiTVOz6Kuk7H9eOg",
    "kind": "unary",
    "transactionId": "oWl09MaiTVOz6Kuk7H9eOg.grpc-server-7c9f8d-q2xkz.494744.10.42.0.67-40122-10.42.0.53-50051.554123633.GrpcCom.5",
    "req": {
        "status": "COMPLETE",
        "service": "echo.Echo",
        "method": "Ping",
        "fullMethod": "echo.Echo/Ping",
        "template": "Ping",
        "streamingKind": "single",
        "messageCount": 1,
        "totalSize": 18,
        "size": 18,
        "metadata": {
            "content-type": "application/grpc",
            "user-agent": "grpc-go/1.64.0"
        },
        "start": 1781081483.696741,
        "startDate": "2026-06-18T08:51:23.696Z",
        "end": 1781081483.696741,
        "endDate": "2026-06-18T08:51:23.696Z",
        "startMinute": "2026-06-18T08:51:00Z"
    },
    "res": {
        "status": "COMPLETE",
        "fullMethod": "echo.Echo/Ping",
        "streamingKind": "single",
        "grpcStatus": 0,
        "grpcStatusName": "OK",
        "grpcMessage": "",
        "messageCount": 1,
        "totalSize": 20,
        "size": 20,
        "metadata": {
            "content-type": "application/grpc"
        },
        "start": 1781081483.696792,
        "startDate": "2026-06-18T08:51:23.696Z",
        "end": 1781081483.696984,
        "endDate": "2026-06-18T08:51:23.696Z"
    },
    "stats": {
        "withTls": true,
        "statusCode": 200,
        "statusText": "OK",
        "duration": 0.00024318695068359375,
        "dst": {
            "ip": "10.42.0.53",
            "name": "grpc-server-7c9f8d-q2xkz",
            "port": 50051,
            "socket": "10.42.0.53:50051"
        },
        "src": {
            "ip": "10.42.0.67",
            "name": "grpc-client-645b88849b-gkrmm.test-grpc-tls.pod.cluster.local.",
            "port": 40122,
            "socket": "10.42.0.67:40122"
        },
        "timespan": {
            "gte": "2026-06-18T08:51:23.696Z",
            "lte": "2026-06-18T08:51:23.696Z"
        },
        "tags": {
            "values": {},
            "count": {},
            "cardinality": {}
        }
    },
    "grpcParsing": "oWl09MaiTVOz6Kuk7H9eOg.grpc-server-7c9f8d-q2xkz.494744.10.42.0.67-40122-10.42.0.53-50051.554123633.GrpcParsingLog"
}
Most fields are self-explanatory. Most fields are indexed and searchable.
Some extra explanation:
| Field | Description |
|---|---|
| kind | unary, server-stream, client-stream, bidi or misc |
| transactionId | Groups all per-message communications of one streaming call; equals @id on a unary call |
| direction | req / res - set on a streaming-message communication; empty on a unary call |
| index | 0-based message index within its direction (streaming only) |
| terminal | true on the last response message (carries the final gRPC status) |
| req.fullMethod | Fully-qualified method service/method (the default req.template) |
| req.template | Computed call name (see Templates) - defaults to fullMethod |
| req|res.metadata | HTTP/2 headers (request) / trailers (response), as key / value pairs |
| req|res.messageCount | Number of protobuf messages on that side |
| res.grpcStatus | The numeric gRPC status code (0 = OK) |
| res.grpcStatusName | The gRPC status name (OK, NOT_FOUND, UNAVAILABLE…) |
| res.grpcMessage | The gRPC status message returned in the trailers |
| stats | Stats object regroup most important information |
| stats.withTls | true when the call was carried over TLS |
| stats.statusCode | The gRPC status mapped onto HTTP semantics |
| stats.timespan | Indexed as range, to allow range searching and aggregations |
| stats.src|dst.name | Hostname resolved on the Whisperer |
| stats.tags.* | Extracted tags values, count and cardinality |
| req|res.status | Parsing status |
The full request and response messages are stored separately (in a dedicated per-message content store) and fetched on demand from the Request / Response tabs, so the communication document itself stays small and fast to search.